Electronic Components Sales Market Analysis and Forecast (May 2025)
Table Of Contents
Prologue
1 Macroeconomics in May
1.1 The Global Manufacturing Industry Remains Hovering at a Low Level
1.2 The Electronic Information Manufacturing Industry Is in Good Shape
1.3 Strong Growth in Semiconductor Sales
2 Chip Delivery Trend in May
2.1 The Overall Chip Delivery Trend
2.2 List of Delivery Cycles of Key Chip Suppliers
3 Orders and Inventory in May
4 Semiconductor Supply Chain in May
4.1 Semiconductor Upstream Manufacturers
(1)Silicon Wafer/Equipment
(2)Fabless/IDM
(3)Foundry
(4)OSAT 24 4.2 Distributor
4.3 System Integration
4.4 Terminal Application
(1)Consumer Electronics
(2)New Energy Vehicles
(3)Industrial Control
(4)Photovoltaic
(5)Energy Storage
(6)Data Center
(7)Communication
(8)Medical Equipment
5 Distribution and Sourcing Opportunities and Risks
5.1 Opportunities
5.2 Risk
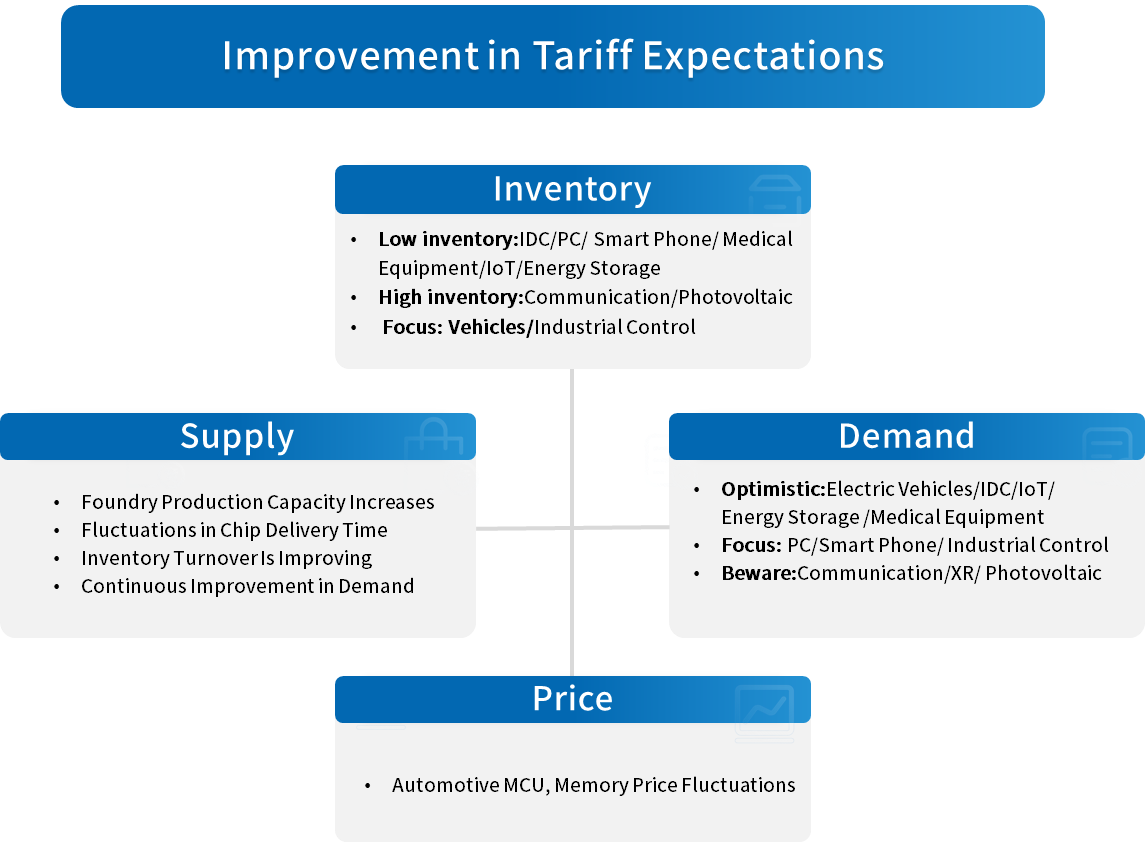
6 Summarize
Disclaimer
Prologue
1 Macroeconomics in May
1.1 The Global Manufacturing Industry Remains Hovering at a Low Level
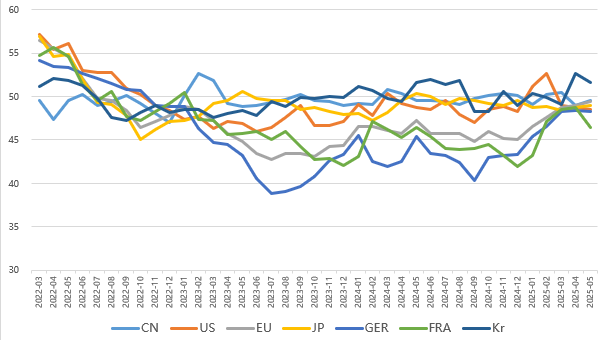
In May, the global manufacturing index rose slightly, while the global economy hovered at a low level. Except for South Korea, China, the United States, Japan, and the European Union represented by Germany and France all remained below the boom-bust balance line. Tariffs still disrupt the global economy, increasing uncertainties in the global economic recovery.
The Organization for Economic Co-operation and Development (OECD) has lowered its forecast for world economic growth this year from 3.1% to 2.9%. The United Nations predicts that this year's economic growth rate will slow from 2.8% in January to 2.4%.
Chart 1: Manufacturing PMI of the world's major economies in May
Source: NBSPRC
1.2 The Electronic Information Manufacturing Industry Is in Good Shape
From January to April 2025, China's electronic information manufacturing sector saw steady production growth, slight fluctuations in exports, a gradual recovery in profitability, and stable investment expansion. The industry as a whole maintained a positive development momentum.
Chart 2: Latest Operation of Electronic Information Manufacturing Industry
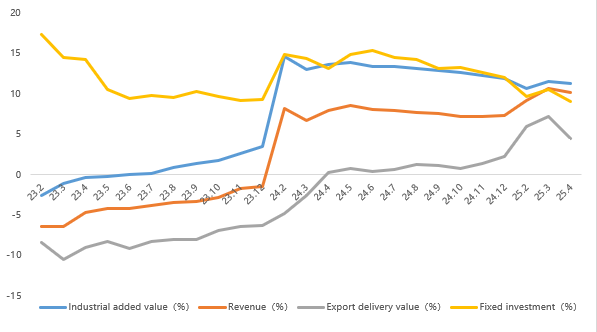
Source: MIIT
1.3 Strong Growth in Semiconductor Sales
According to the latest data from SIA, global semiconductor market sales reached $56.96 billion in April 2025, a year-on-year increase of 22.7%, with year-on-year growth exceeding 17% for 12 consecutive months. Month-on-month sales grew by 2.5%, the first increase since 2025.
In terms of regional markets, the American market grew strongly, with a year-on-year increase of 44.4%.mainland China and Japan saw year-on-year growth of 14.4% and 4.3% respectively. The Asia-Pacific region grew by 23.1% year-on-year, and European sales also rose slightly by 0.1%.
Chart 3: Latest global semiconductor industry sales and growth rate
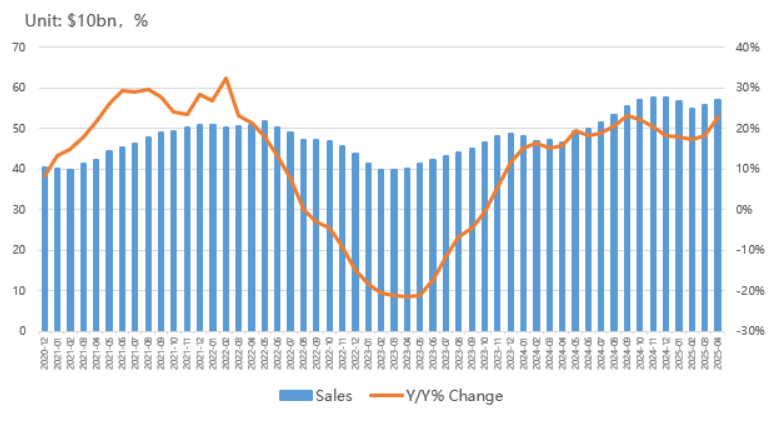
Source: SIA,Chip Insights
In terms of integrated circuit (IC) production, global IC output reached approximately 126.6 billion units in April, a year-on-year increase of 17.0%. China's output exceeded 41.67 billion units, declining month-on-month but still maintaining growth.
Chart 4: Latest global and Chinese integrated circuit production and growth rate
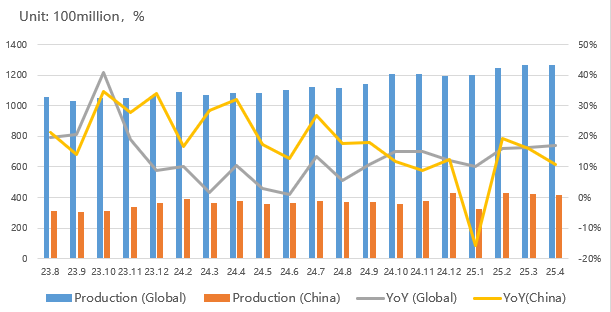
Source: NBSPRC,SIA,Chip Insights
In terms of imports and exports, China's IC imports and exports remained highly robust in April. Notably, export growth soared to 21.3% year-on-year, reflecting a positive trend.
Chart 5: Latest import and export amount and growth rate of integrated circuits in China
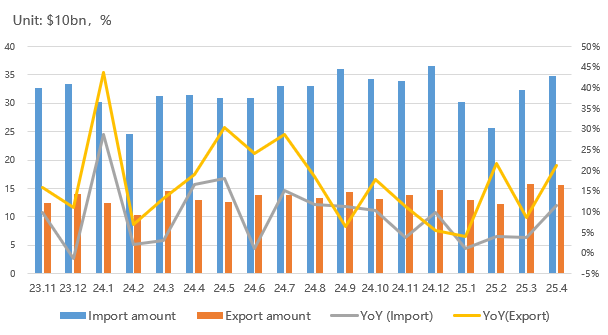
Source: MIIT,SIA,Chip Insights
From the perspective of capital market indices, the Philadelphia Semiconductor Index (SOX) rose by 10.4% in May, while China's Semiconductor (SW) industry index fell by 7.9%. Domestic semiconductor capital markets were clearly impacted by tariffs.
Chart 6: Trend of SOX and SW Index in May
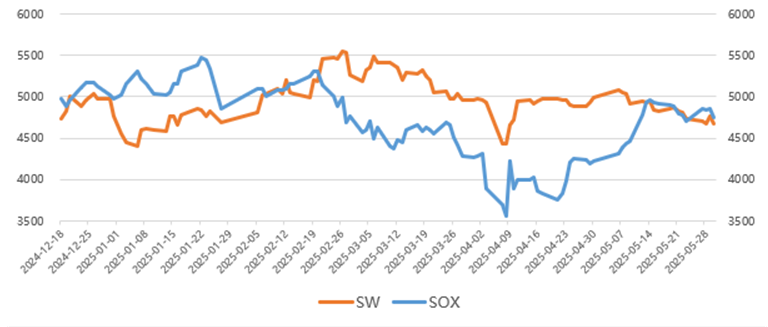
Source: Wind,Chip Insights
For more information, please refer to the attached report.