Electronic Components Sales Market Analysis and Forecast (April 2025)
Table Of Contents
Prologue
1 Macroeconomics in April
1.1 The Global Manufacturing Industry Remains Weak
1.2 The Electronic Information Manufacturing Industry Has Grown Rapidly
1.3 The Growth of Semiconductor Sales Continues
2 Chip Delivery Trend in April
2.1 The Overall Chip Delivery Trend
2.2 List of Delivery Cycles of Key Chip Suppliers
3 Orders and Inventory in April
4 Semiconductor Supply Chain in April
4.1 Semiconductor Upstream Manufacturers
(1)Silicon Wafer/Equipment
(2)Fabless/IDM
(3)Foundry
(4)OSAT
4.2 Distributor
4.3 System Integration
4.4 Terminal Application
(1)Consumer Electronics
(2)New Energy Vehicles
(3)Industrial Control
(4)Photovoltaic
(5)Energy Storage
(6)Data Center
(7)Communication
(8)Medical Equipment
5 Distribution and Sourcing Opportunities and Risks
5.1 Opportunities
5.2 Risk
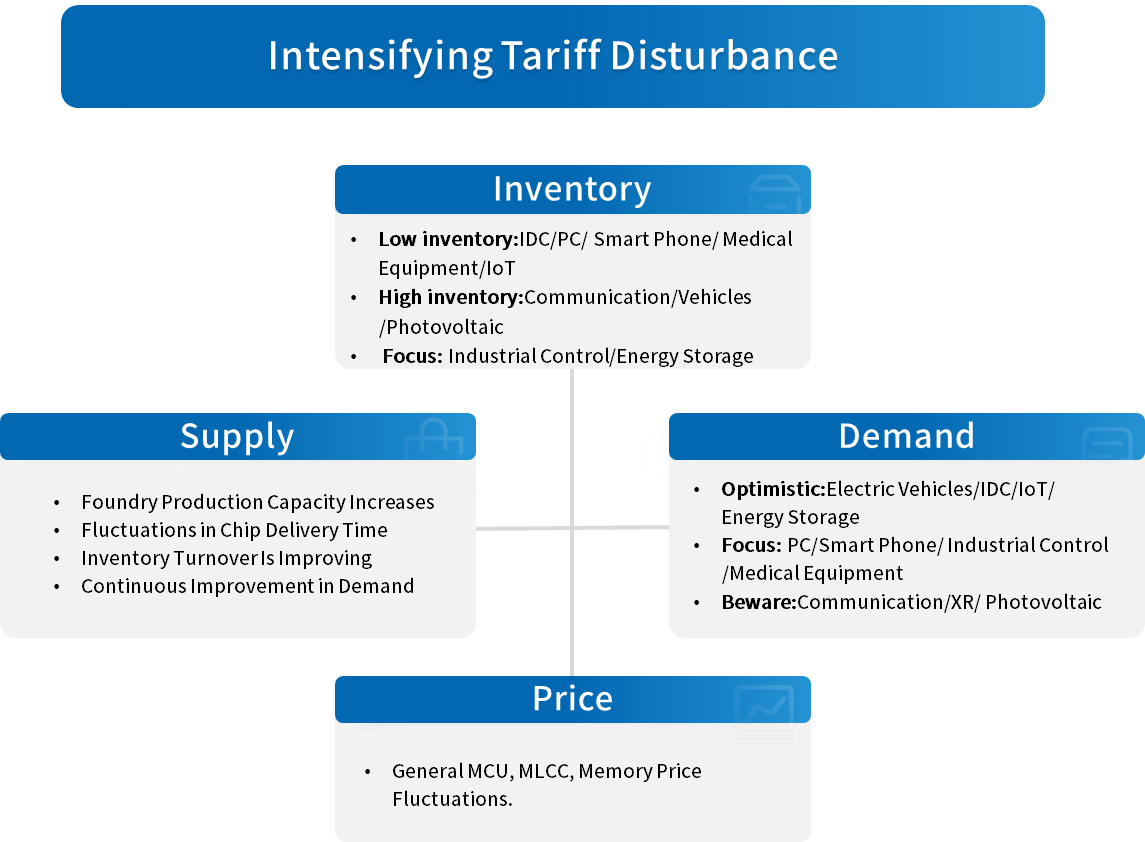
6 Summarize
Disclaimer
Prologue
1 Macroeconomics in April
1.1 The Global Manufacturing Industry Remains Weak
In April, the global manufacturing industry continued to be weak, and the economy was under obvious pressure. Disturbed by the tariffs imposed by the United States, the risk of global economic downturn gradually increased. China, the United States, Japan, South Korea, and the European Union represented by Germany and France were all below the boom-bust line. All countries had to face the pressure of restructuring the industrial chain and supply chain, and market fluctuations intensified.
Chart 1: Manufacturing PMI of the world's major economies in April
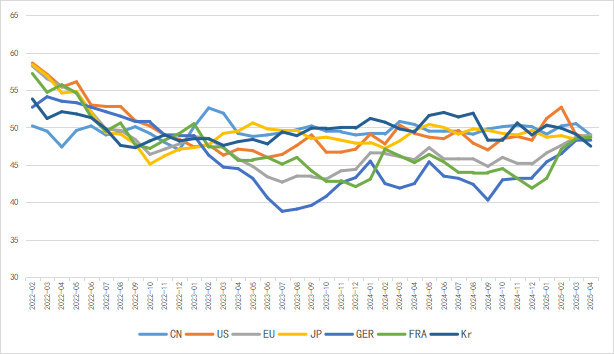
Source: NBSPRC
Major institutions have lowered their expectations for future economic and trade growth. The IMF has lowered its forecast for global economic growth in 2025 to 2.8%. The World Trade Organization has warned that due to the impact of the US tariff policy, the growth rate of global merchandise trade volume in 2025 has dropped from the long-term growth of nearly 3% to -0.2%.
1.2 The Electronic Information Manufacturing Industry Has Grown Rapidly
From January to March 2024, China's electronic information manufacturing industry has seen relatively rapid production growth, maintained export growth, steadily improved its efficiency, and continued to have rapid investment. The overall development trend of the industry is good.
Chart 2: Latest Operation of Electronic Information Manufacturing Industry
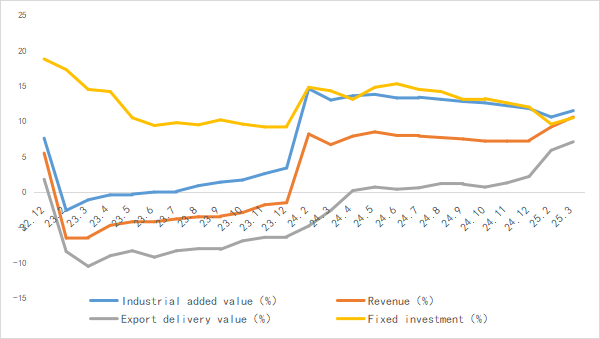
Source: MIIT
1.3 The Growth of Semiconductor Sales Continues
According to the latest data from the SIA, the global semiconductor market sales in March 2025 were $55.90 billion, representing a year-on-year growth of 18.84%. The year-on-year growth rate has exceeded 17% for 11 consecutive months, and market demand remains at a high level.
In terms of regional markets, the American market continues to boom, with a year-on-year growth of 45.3%. Mainland China and Japan have respectively achieved a year-on-year growth of 7.6% and 5.8%. The Asia-Pacific region has seen a year-on-year growth of 15.4%, while sales in Europe have continued to decline by 2.0%.
Chart 3: Latest global semiconductor industry sales and growth rate
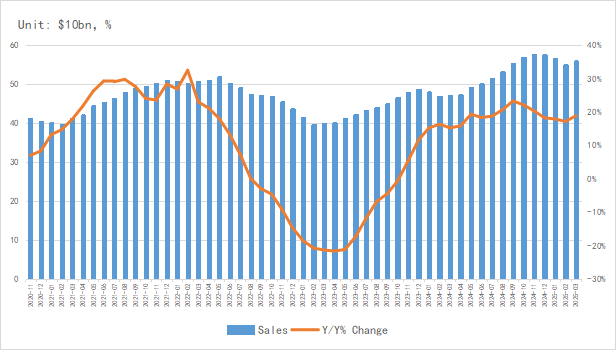
Source: SIA,Chip Insights
In terms of the output of integrated circuits, the global output of integrated circuits in March exceeded 126 billion pieces, representing a year-on-year growth of 16.4%.China's output was 41.97 billion pieces, maintaining steady growth.
Chart 4: Latest global and Chinese integrated circuit production and growth rate
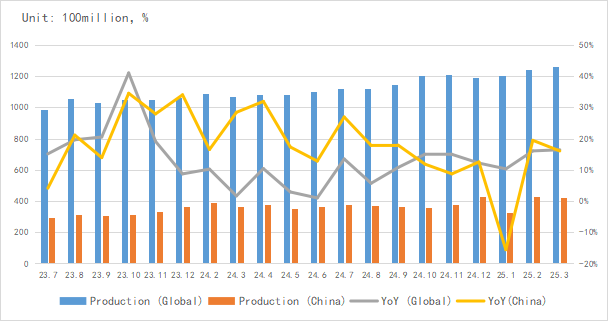
Source: NBSPRC,SIA,Chip Insights
In terms of imports and exports, China's integrated circuit trade showed stable growth in March, with growth rates of 3.7% and 8.5% respectively, and export trade grew relatively rapidly.
Chart 5: Latest import and export amount and growth rate of integrated circuits in China
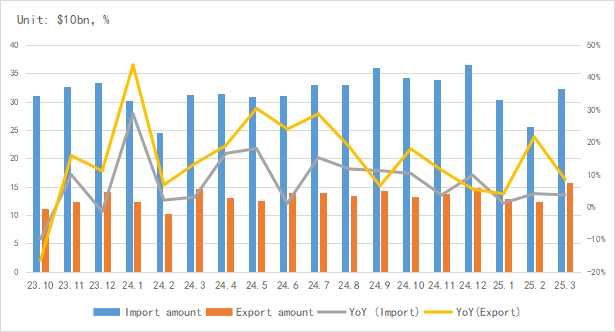
Source: MIIT,SIA,Chip Insights
In terms of capital market indices, the SOX index fell by 1.2% in April, while the China Semiconductor (SW) industry index rose slightly by 0.4%. The semiconductor markets at home and abroad have been greatly affected by tariffs and have fluctuated significantly.
Chart 6: Trend of SOX and SW Index in April
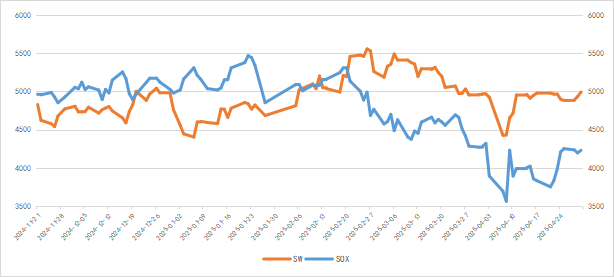
Source: Wind,Chip Insights
For more information, please refer to the attached report.