Electronic Components Sales Market Analysis and Forecast (May 2023)
Table Of Contents
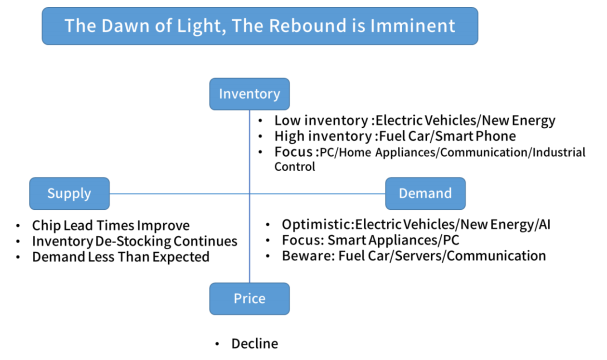
Prologue
1 Macroeconomics in May
1.1 The Global Manufacturing Downward Pressure Increases
1.2 The Electronic Information Manufacturing Industry has Improved, Still in The Doldrums
1.3 The Semiconductor Sales U.S. Dominates as Index Rebounds
2 Chip Delivery Trend in April
2.1 The Overall Chip Delivery Trend
2.2 List of Delivery Cycles of Key Chip Suppliers
3 Orders and Inventory in May
4 Semiconductor Supply Chain in May
4.1 Semiconductor Upstream Manufacturers
(1)Silicon Wafer/Equipment
(2)Fabless/IDM
(3)Foundry
(4)OSAT
4.2 Distributor
4.3 System Integration
4.4 Terminal Application
(1)Consumer Electronics
(2)New Energy Vehicles
(3)Industrial Control
(4)Photovoltaic
(5)Energy Storage
(6)Server
(7)Communication
5 Distribution and Sourcing Opportunities and Risks
5.1 Opportunities
5.2 Risk
6 Summarize
Disclaimer
Prologue
1 Macroeconomics in May
1.1 The Global Manufacturing Downward Pressure Increases
In May, the global economic index fell continuously, including China, the United States, the European Union and the United Kingdom and other major economies are below the critical point, economic downward pressure continues to increase.
Chart 1: Manufacturing PMI of the world's major economies in May

Source: NBSPRC
In summary, the issue of high inflation is also plaguing the global economic recovery, with the WTO forecasting a below-average 1.7% growth in global merchandise trade volumes in 2023.
1.2 The Electronic Information Manufacturing Industry has Improved, Still in The Doldrums
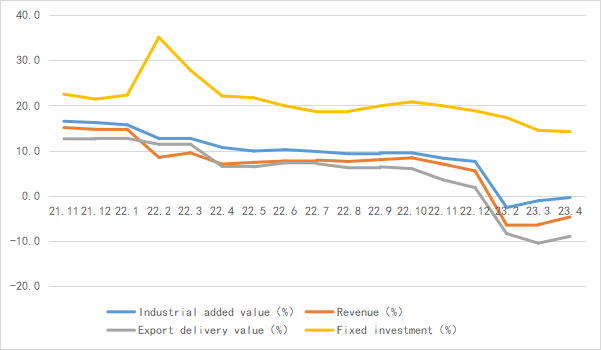
From January to April, the electronic information manufacturing production gradually recovered, exports narrowed, benefits continued to improve, and investment grew steadily.
Chart 2: Operation of electronic information manufacturing industry in April 2023
Source: MIIT
1.3 The Semiconductor Sales U.S. Dominates as Index Rebounds
According to the latest SIA data, in 2022, U.S. companies accounted for 48% of global semiconductor sales, South Korea accounted for 19%, Taiwan Province of China accounted for 8%, China accounted for 7%.
Chart 3: The Share of Global semiconductor sales in 2022
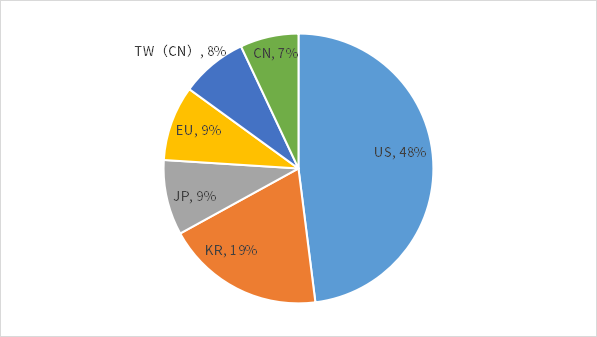
Source: SIA, Chip Insights
From the perspective of capital market indexes, the SOX rose 17.6% in May, while the SW industry index edged down 0.6%. Signs of a rebound in the semiconductor market are evident as investor confidence picks up.
Chart 4: Trend of SOX and SW Index in May

Source: Wind
For more information, please refer to the attached report.