Electronic Components Sales Market Analysis and Forecast (October 2025)
Table Of Contents
Prologue
1 Macroeconomics in October
1.1 The Volatility in the Global Manufacturing Industry Continue
1.2 The Electronic Information Manufacturing Industry Is on a Steady Rise
1.3 Strong Semiconductor Sales
2 Chip Delivery Trend in October
2.1 The Overall Chip Delivery Trend
2.2 List of Delivery Cycles of Key Chip Suppliers
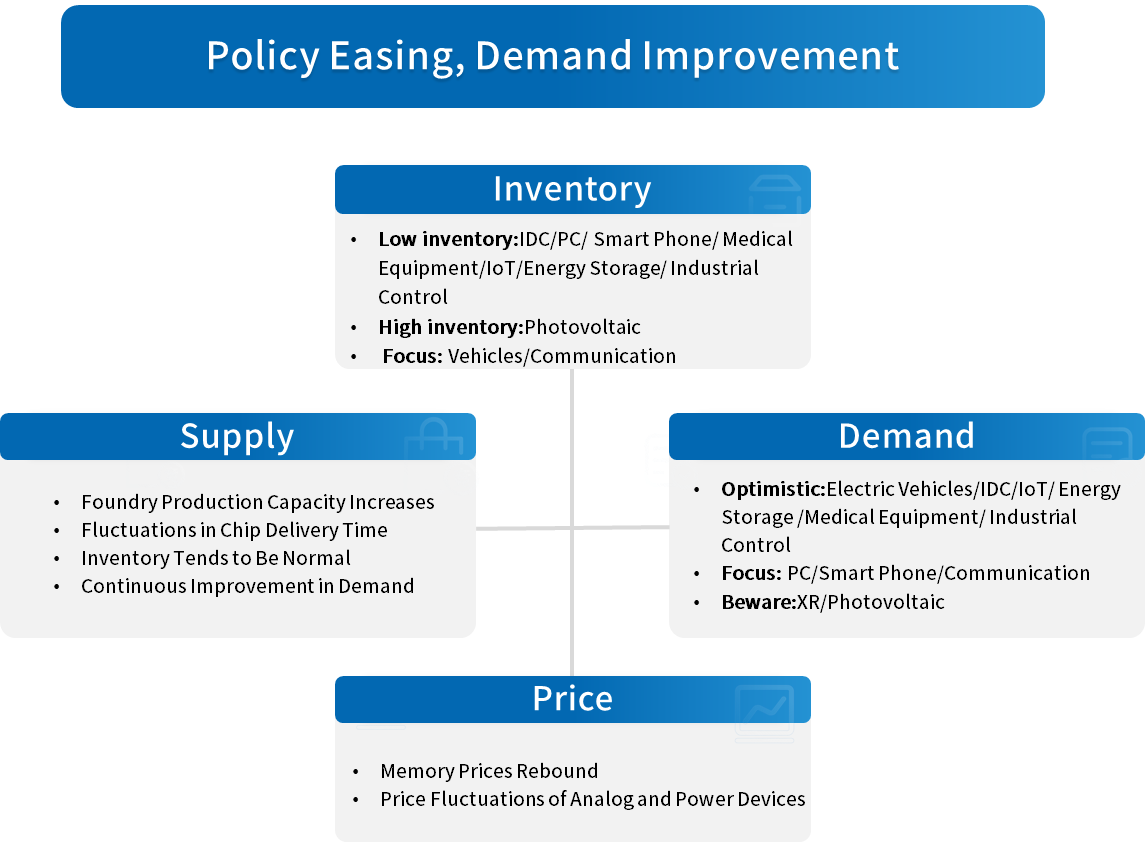
3 Orders and Inventory in October
4 Semiconductor Supply Chain in October
4.1 Semiconductor Upstream Manufacturers
(1)Silicon Wafer/Equipment
(2)Fabless/IDM
(3)Foundry
(4)OSAT
4.2 Distributor
4.3 System Integration
4.4 Terminal Application
(1)Consumer Electronics
(2)New Energy Vehicles
(3)Industrial Control
(4)Photovoltaic
(5)Energy Storage
(6)Data Center
(7)Communication
(8)Medical Equipment
5 Distribution and Sourcing Opportunities and Risks
5.1 Opportunities
5.2 Risk
6 Summarize
Disclaimer
Prologue
1 Macroeconomics in October
1.1 The Volatility in the Global Manufacturing Industry Continue
In October, fluctuations in the global manufacturing PMI continued, and the economic performance of various countries/regions showed significant divergence. Except for the United States, China, France, South Korea, and Japan all declined. Among them, the EU region stopped falling and stabilized after more than three years of continuous contraction, but failed to achieve growth, with weak demand growth.
Chart 1: Manufacturing PMI of the world's major economies in October

Source: NBSPRC
1.2 The Electronic Information Manufacturing Industry Is on a Steady Rise
In the first three quarters of 2025, China's electronic information manufacturing industry achieved rapid growth in production, maintained stable exports, saw steady growth in benefits, and experienced a slight decline in investment. Overall, the industry maintained a sound development momentum.
Chart 2: Latest Operation of Electronic Information Manufacturing Industry
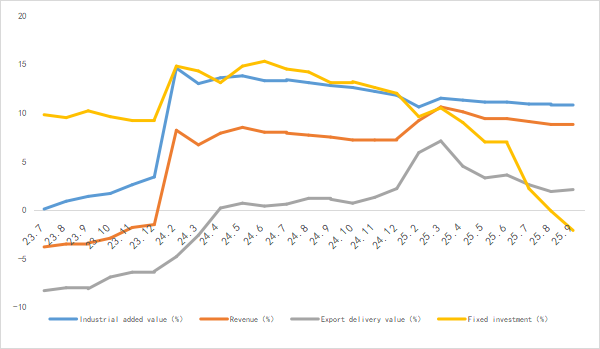
Source: MIIT
1.3 Strong Semiconductor Sales
According to the latest data from the SIA, the global semiconductor market sales reached $69.47 billion in September, representing a year-on-year (YoY) growth of 25.1%. This marks the 17th consecutive month that the YoY growth rate has exceeded 17%, and the growth rate in the third quarter (Q3) was significantly higher than that in the second quarter (Q2).
In terms of regional markets, the Asia-Pacific and the Americas remain the major growth-driven markets. Specifically, the Americas market posted a YoY growth of 30.6%. the Chinese mainland market achieved a YoY growth of 15.0%. the Asia-Pacific market saw a YoY growth of 47.9%. while sales in Japan and Europe recorded changes of -10.2% and 6.0% YoY respectively.
Chart 3: Latest global semiconductor industry sales and growth rate
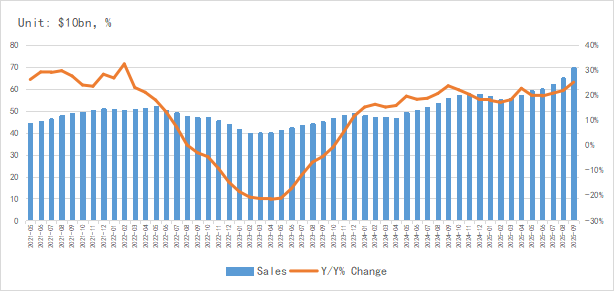
Source: SIA,Chip Insights
In terms of integrated circuit (IC) output, the global and Chinese IC output in September reached 131.3 billion units and 4.371 billion units respectively, maintaining stable growth.
Chart 4: Latest global and Chinese integrated circuit production and growth rate
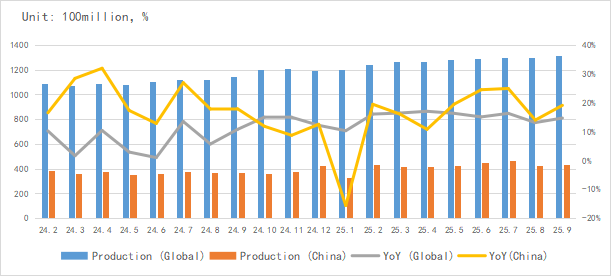
Source: NBSPRC,SIA,Chip Insights
Regarding import and export, China's IC exports continued to register strong growth in September, with an average monthly growth rate exceeding 30% over the past five months.
Chart 5: Latest import and export amount and growth rate of integrated circuits in China
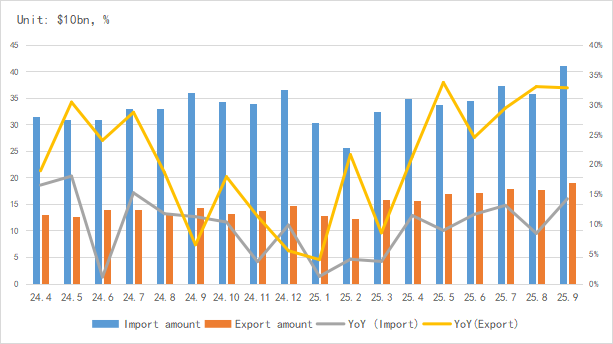
Source: MIIT,SIA,Chip Insights
From the perspective of capital market indices, the Philadelphia Semiconductor Index (SOX) rose by 5.7% in October, while the China Semiconductor (SW) Industry Index fell by 8.3%. Driven by favorable AI-related factors in overseas capital markets, the industry boom continued to move upward.
Chart 6: Trend of SOX and SW Index in October
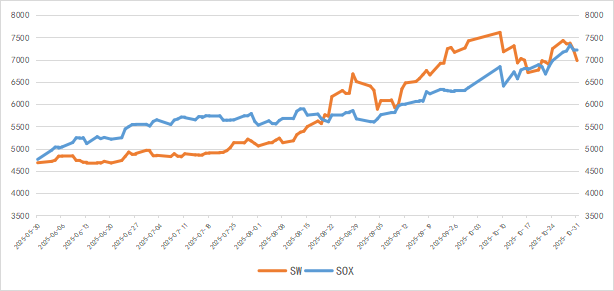 Source: Wind,Chip Insights
For more information, please refer to the attached report.