Electronic Components Sales Market Analysis and Forecast (September 2025)
Table Of Contents
Prologue
1 Macroeconomics in September
1.1 The global manufacturing sector maintains a stable posture
1.2 The Electronic Information Manufacturing Industry Maintains a Stable Posture
1.3 Semiconductor Sales Volume Remains Stable
2 Chip Delivery Trend in September
2.1 The Overall Chip Delivery Trend
2.2 List of Delivery Cycles of Key Chip Suppliers
3 Orders and Inventory in September
4 Semiconductor Supply Chain in September
4.1 Semiconductor Upstream Manufacturers
(1)Silicon Wafer/Equipment
(2)Fabless/IDM
(3)Foundry
(4)OSAT
4.2 Distributor
4.3 System Integration
4.4 Terminal Application
(1)Consumer Electronics
(2)New Energy Vehicles
(3)Industrial Control
(4)Photovoltaic
(5)Energy Storage
(6)Data Center
(7)Communication
(8)Medical Equipment
5 Distribution and Sourcing Opportunities and Risks
5.1 Opportunities
5.2 Risk
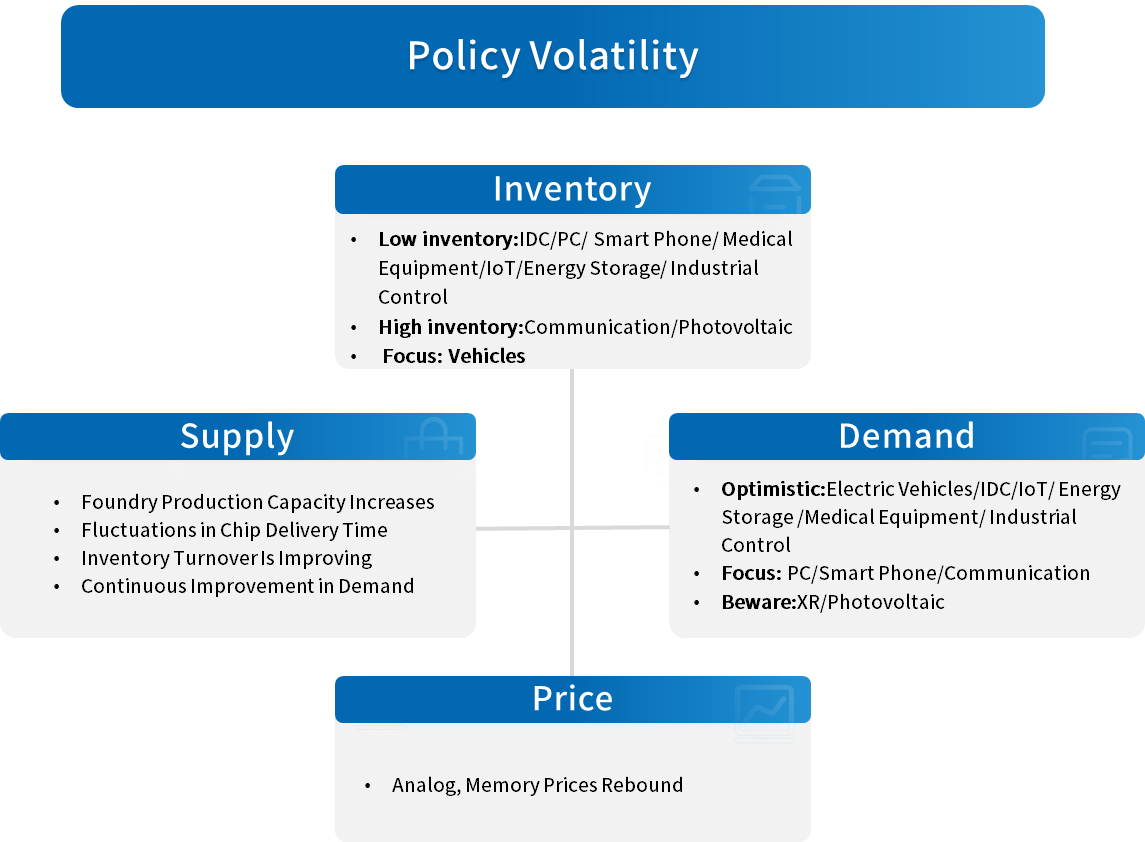
6 Summarize
Disclaimer
Prologue
1 Macroeconomics in September
1.1 The global manufacturing sector maintains a stable posture
In September, the global manufacturing PMI (Purchasing Managers' Index) showed little fluctuation, and the economic recovery maintained a relatively stable momentum. Except for the United States and South Korea, the indices of China, the European Union and Japan declined. Although the global economic recovery has remained stable within a certain range, the situation of weak growth in market demand has not changed, and disruptions from trade frictions and geopolitical conflicts persist.
Chart 1: Manufacturing PMI of the world's major economies in September
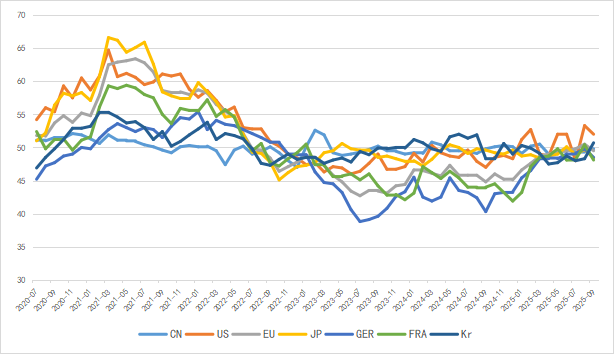
Source: NBSPRC
1.2 The Electronic Information Manufacturing Industry Maintains a Stable Posture
From January to August 2025, China's electronic information manufacturing industry has achieved rapid growth in production, seen a slight decline in exports, maintained a steady and positive trend in benefits, and experienced a slowdown in investment growth. Overall, the industry maintains a sound development momentum.
Chart 2: Latest Operation of Electronic Information Manufacturing Industry
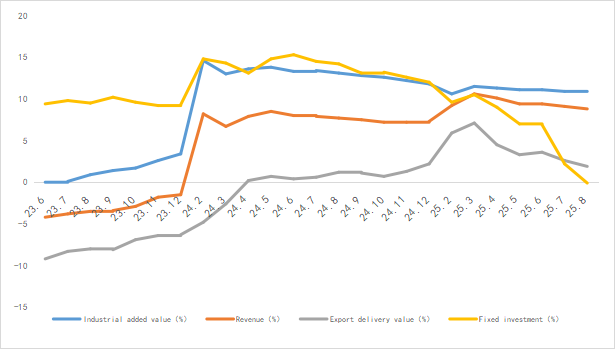
Source: MIIT
1.3 Semiconductor Sales Volume Remains Stable
market sales reached $64.88 billion in August, representing a year-on-year (YoY) growth of 21.7%. This marks the 16th consecutive month that the YoY growth rate has exceeded 17%, continuing the strong growth momentum.
In terms of regional markets, the Asia-Pacific and Americas regions are the main growth drivers. Sales in the Americas market amounted to $20.78 billion, with a YoY increase of 25.5%.the Chinese mainland saw a YoY growth of 12.4%, while the Asia-Pacific region achieved a YoY growth of 43.1%. In contrast, sales in Japan and Europe recorded changes of -6.9% and 4.4% YoY, respectively.
Chart 3: Latest global semiconductor industry sales and growth rate
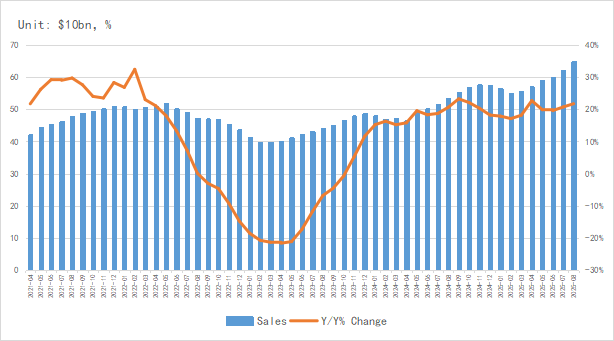
Source: SIA,Chip Insights
In terms of integrated circuit (IC) output, the global and China's IC output in August reached 129.5 billion units and 42.50 billion units respectively, with stable year-on-year (YoY) growth.
Chart 4: Latest global and Chinese integrated circuit production and growth rate
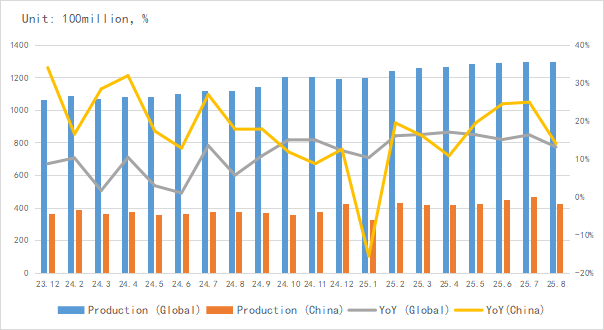
Source: NBSPRC,SIA,Chip Insights
In terms of import and export, China's integrated circuit (IC) exports continued their strong growth in August, marking the 5th consecutive month with a growth rate exceeding 21%.
Chart 5: Latest import and export amount and growth rate of integrated circuits in China
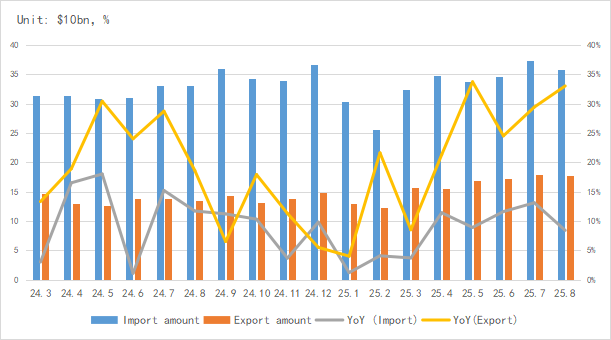
Source: MIIT,SIA,Chip Insights
From the perspective of capital market indices, the Philadelphia Semiconductor Index (SOX) rose by 13.6% in September, and the China Semiconductor (SW) Industry Index increased by 15.9%. The prosperity of the global semiconductor capital market continues to move upward.
Chart 6: Trend of SOX and SW Index in September
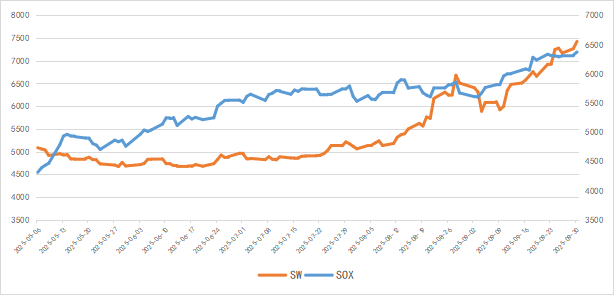
Source: Wind,Chip Insights
For more information, please refer to the attached report.