Electronic Components Sales Market Analysis and Forecast (August 2025)
Table Of Contents
Prologue
1 Macroeconomics in August
1.1 The Global Manufacturing Sector Has Rebounded Slightly
1.2 The Electronic Information Manufacturing Industry Fluctuated Downward
1.3 Semiconductor Sales Remain Strong
2 Chip Delivery Trend in August
2.1 The Overall Chip Delivery Trend
2.2 List of Delivery Cycles of Key Chip Suppliers
3 Orders and Inventory in August
4 Semiconductor Supply Chain in August
4.1 Semiconductor Upstream Manufacturers
(1)Silicon Wafer/Equipment
(2)Fabless/IDM
(3)Foundry
(4)OSAT
4.2 Distributor
4.3 System Integration
4.4 Terminal Application
(1)Consumer Electronics
(2)New Energy Vehicles
(3)Industrial Control
(4)Photovoltaic
(5)Energy Storage
(6)Data Center
(7)Communication
(8)Medical Equipment
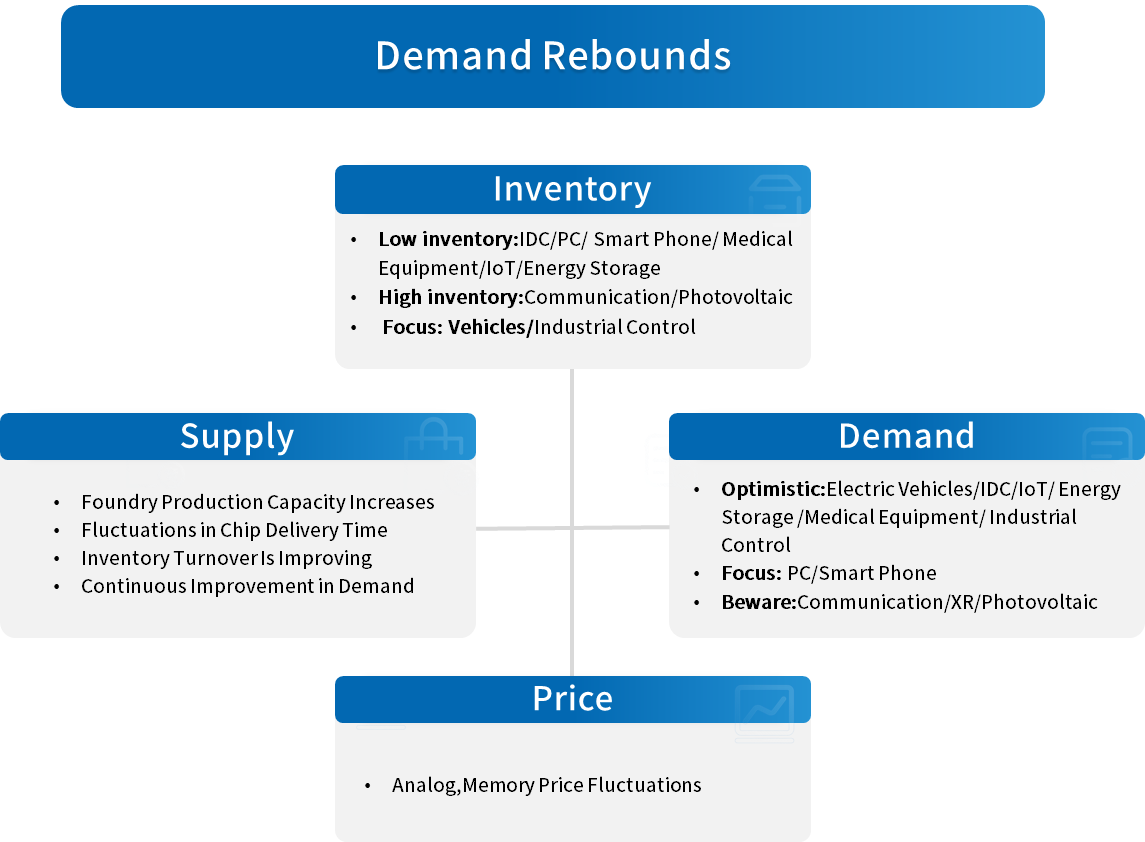
5 Distribution and Sourcing Opportunities and Risks
5.1 Opportunities
5.2 Risk
6 Summarize
Disclaimer
Prologue
1 Macroeconomics in August
1.1 The Global Manufacturing Sector Has Rebounded Slightly
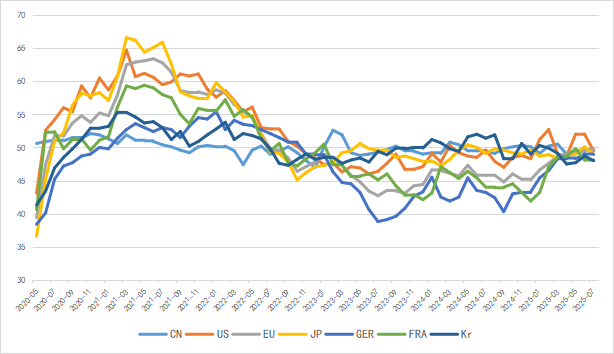
In August, the global manufacturing PMI rebounded with a continuous increase in the recovery momentum. Among them, China, the United States, the European Union and Japan saw significant rises. The European Union broke through 50% for the first time after more than three years of decline. The global economic recovery is shifting for the better, but the overall recovery momentum still needs to be enhanced.
The latest report from the WTO predicts that global merchandise trade volume will grow by 0.9% in 2025, which is higher than the -0.2% forecast in April, but still lower than the 2.7% before tariffs were raised.
Chart 1: Manufacturing PMI of the world's major economies in August
Source: NBSPRC
1.2 The Electronic Information Manufacturing Industry Fluctuated Downward
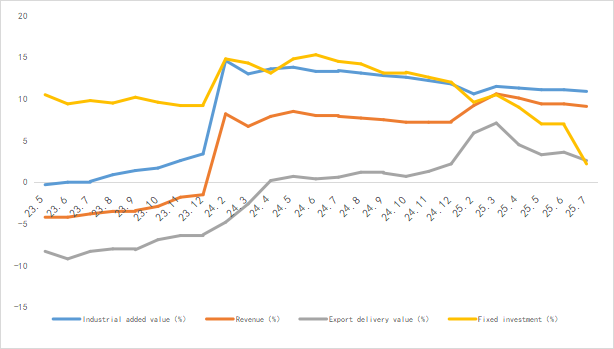
From January to July 2025, China's electronic information manufacturing industry maintained steady production growth, saw slight fluctuations in exports, achieved stable and positive benefits, and witnessed a slowdown in investment growth. The industry maintained a stable operational situation.
Chart 2: Latest Operation of Electronic Information Manufacturing Industry
Source: MIIT
1.3 Semiconductor Sales Remain Strong
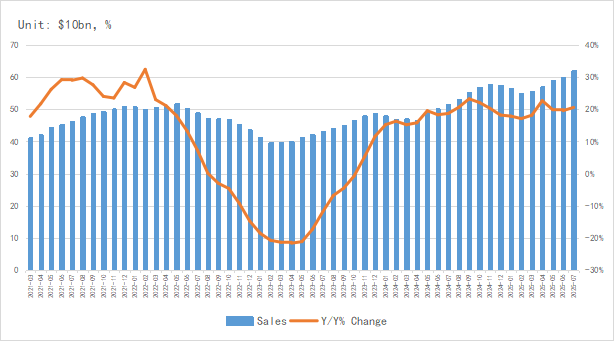
According to the latest data from SIA, the global semiconductor market sales reached $62.07 billion in July 2025, a year-on-year increase of 20.6%, and the year-on-year growth rate has exceeded 17% for 15 consecutive months.
In terms of regional markets, the Asia-Pacific and American markets grew strongly. The sales volume of the American market reached $19.91 billion, a year-on-year increase of 29.3%.the Chinese mainland saw a year-on-year increase of 10.4%, the Asia-Pacific region grew by 35.6% year-on-year, while the sales of Japan and Europe were -66.3% and 5.7% respectively.
Chart 3: Latest global semiconductor industry sales and growth rate
Source: SIA,Chip Insights
In terms of integrated circuit output, the global integrated circuit output in July was approximately 129.9 billion units, a year-on-year increase of over 16%.China's output exceeded 46.89 billion units, with a cumulative output of 294.55 billion units from January to July.
Chart 4: Latest global and Chinese integrated circuit production and growth rate
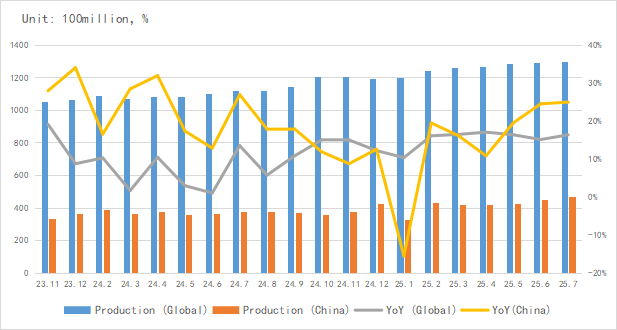
Source: NBSPRC,SIA,Chip Insights
In terms of imports and exports, China's integrated circuit exports maintained high growth in July, with the growth rate exceeding 21% for four consecutive months.
Chart 5: Latest import and export amount and growth rate of integrated circuits in China
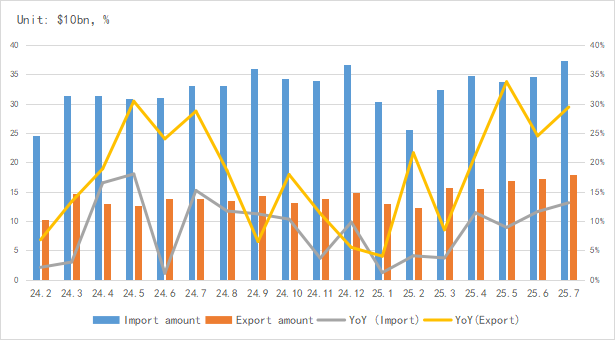
Source: MIIT,SIA,Chip Insights
In terms of capital market indices, the Philadelphia Semiconductor Index (SOX) rose by 2.6% in August, and the China Semiconductor (SW) Industry Index increased by 28.6%, indicating a strong recovery in the prosperity of China's semiconductor capital market.
Chart 6: Trend of SOX and SW Index in August
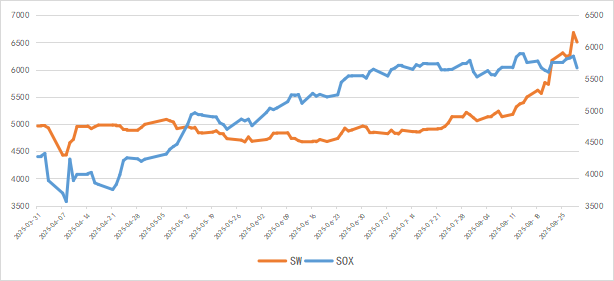
Source: Wind,Chip Insights
For more information, please refer to the attached report.