Electronic Components Sales Market Analysis and Forecast (March 2025)
Table Of Contents
Prologue
1 Macroeconomics in March
1.1 Global Manufacturing Recovery Weakens with Divergence
1.2 The Electronic Information Manufacturing Industry Has Grown Rapidly
1.3 Semiconductor Sales Hit a New Record
2 Chip Delivery Trend in March
2.1 The Overall Chip Delivery Trend
2.2 List of Delivery Cycles of Key Chip Suppliers
3 Orders and Inventory in March
4 Semiconductor Supply Chain in March
4.1 Semiconductor Upstream Manufacturers
(1)Silicon Wafer/Equipment
(2)Fabless/IDM
(3)Foundry
(4)OSAT
4.2 Distributor
4.3 System Integration
4.4 Terminal Application
(1)Consumer Electronics
(2)New Energy Vehicles
(3)Industrial Control
(4)Photovoltaic
(5)Energy Storage
(6)Data Center
(7)Communication
(8)Medical Equipment
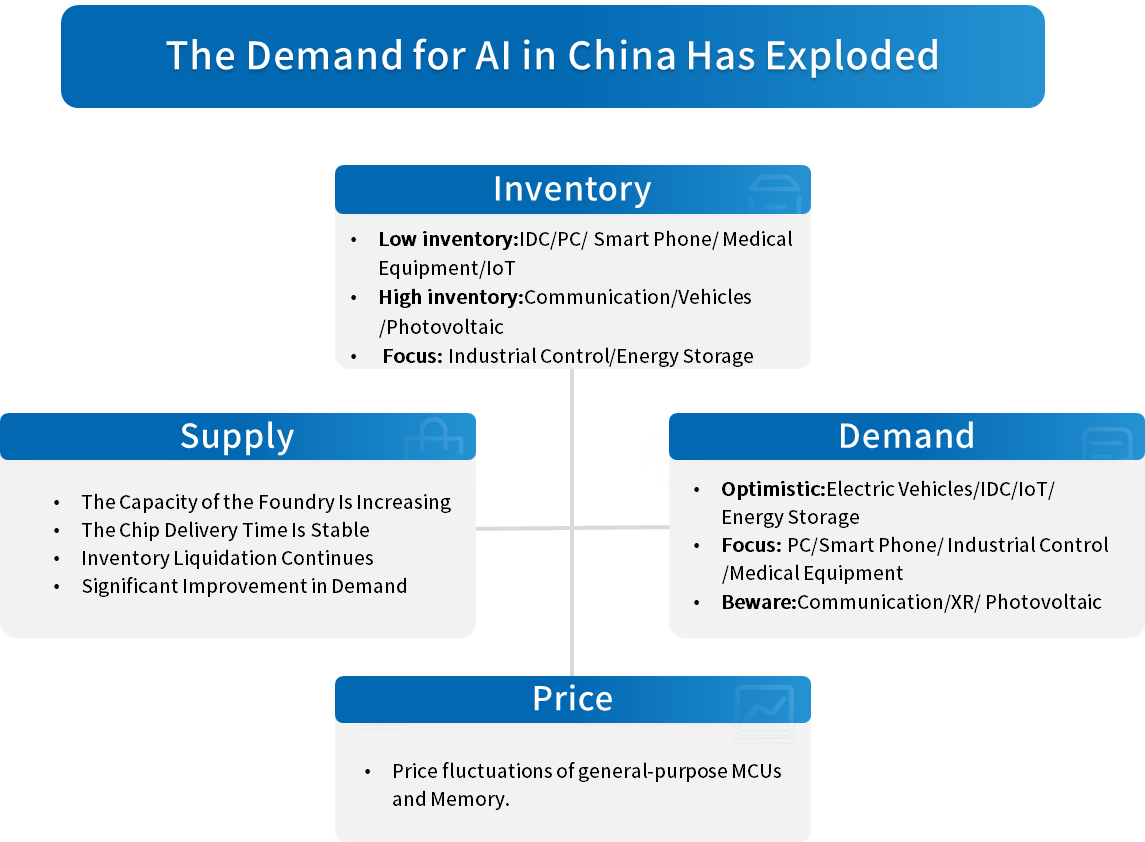
5 Distribution and Sourcing Opportunities and Risks
5.1 Opportunities
5.2 Risk
6 Summarize
Disclaimer
Prologue
1 Macroeconomics in March
1.1 Global Manufacturing Recovery Weakens with Divergence
In March, global manufacturing recovery weakened, with low-speed growth becoming normalized. Key economies including the U.S., Japan, South Korea, Germany, and France remained below the 50% PMI threshold (contraction zone), while regional divergence persisted. Notably, U.S. tariff policies accelerated global trade friction and supply chain disruption risks, prompting OECD and IMF to lower global growth forecasts.
Chart 1: Manufacturing PMI of the world's major economies in March
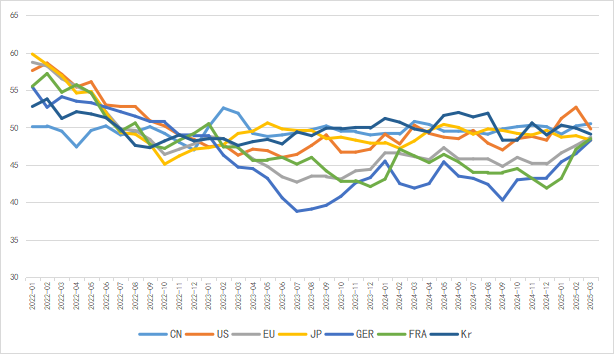
Source: NBSPRC
United Nations predicts China's manufacturing rebound to drive accelerated growth in Asian manufacturing sector.East Asia's economic growth rate to reach 4.7% in 2025, sustaining high-level performance.
1.2 The Electronic Information Manufacturing Industry Has Grown Rapidly
From January to February 2025, the production of China's electronic information manufacturing industry grew rapidly, exports continued to recover, efficiency declined somewhat, the growth rate of investment decreased slightly, and the overall development trend of the industry was favorable.
Chart 2: Latest Operation of Electronic Information Manufacturing Industry
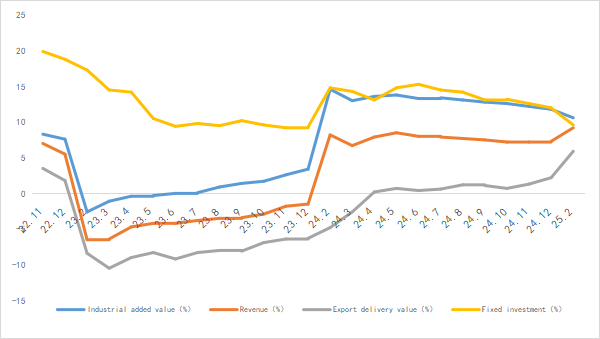
Source: MIIT
1.3 Semiconductor Sales Hit a New Record
According to the latest data from SIA, the global semiconductor market sales in February 2025 were $54.92 billion, a year-on-year increase of 17.1%, setting a historical sales record for February and achieving a year-on-year growth rate of over 17% for 10 consecutive months.
In terms of regional markets, the American market grew strongly, with a year-on-year growth rate as high as 48.4%, leading the growth of the global semiconductor market.the Chinese mainland region grew by 5.6% year-on-year affected by the season, Japan grew by 5.1%, and the sales in Europe continued to decline by 8.1%.
Chart 3: Latest global semiconductor industry sales and growth rate
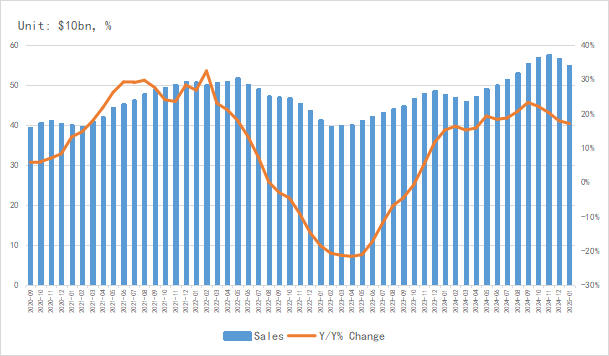
Source: SIA,Chip Insights
In terms of the output of integrated circuits, the global output of integrated circuits in February was approximately 124.4 billion pieces, a year-on-year increase of 14.2%.China's output exceeded 43 billion pieces, and the cumulative output from January to February was 76.7 billion pieces, maintaining growth.
Chart 4: Latest global and Chinese integrated circuit production and growth rate
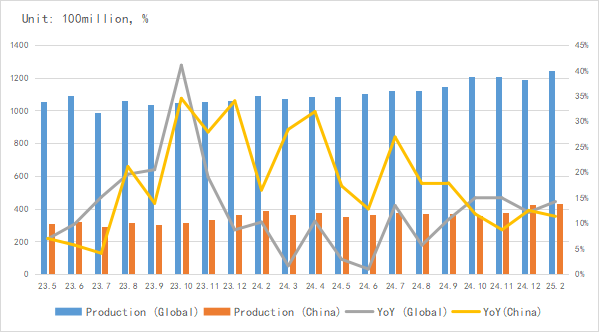
Source: NBSPRC,SIA,Chip Insights
In terms of imports and exports, the imports and exports of integrated circuits in China maintained growth in February. Among them, the year-on-year growth rate of exports soared to 21.6%, reaching a new historical high for the same period.
Chart 5: Latest import and export amount and growth rate of integrated circuits in China
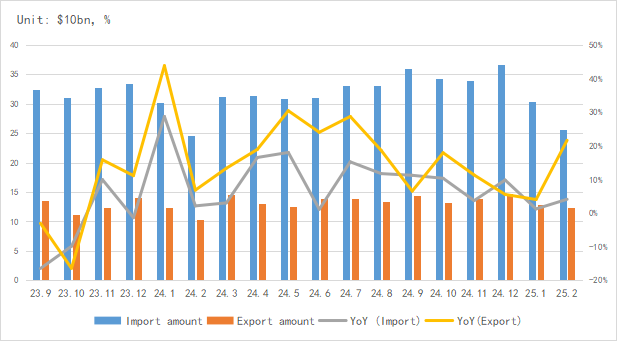
Source: MIIT,SIA,Chip Insights
From the perspective of capital market indices, the SOX fell by 6.7% in March, and the Chinese Semiconductor (SW) industry index decreased by 4.3%. The semiconductor capital markets at home and abroad fluctuated slightly due to the impact of tariffs.
Chart 6: Trend of SOX and SW Index in March
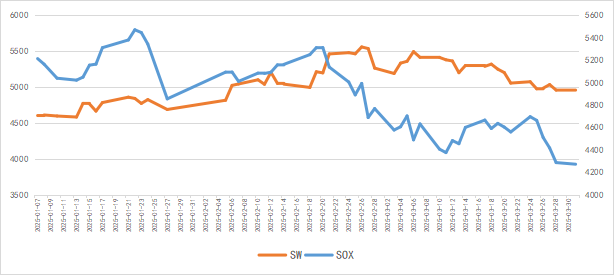
Source: Wind,Chip Insights
For more information, please refer to the attached report.