Electronic Components Sales Market Analysis and Forecast (August 2024)
Table Of Contents
Prologue
1 Macroeconomics in August
1.1 Global Manufacturing Pressure Continues
1.2 Stable Growth of Electronic Information Manufacturing Industry
1.3 Optimistic Semiconductor Sales Trend
2 Chip Delivery Trend in August
2.1 The Overall Chip Delivery Trend
2.2 List of Delivery Cycles of Key Chip Suppliers
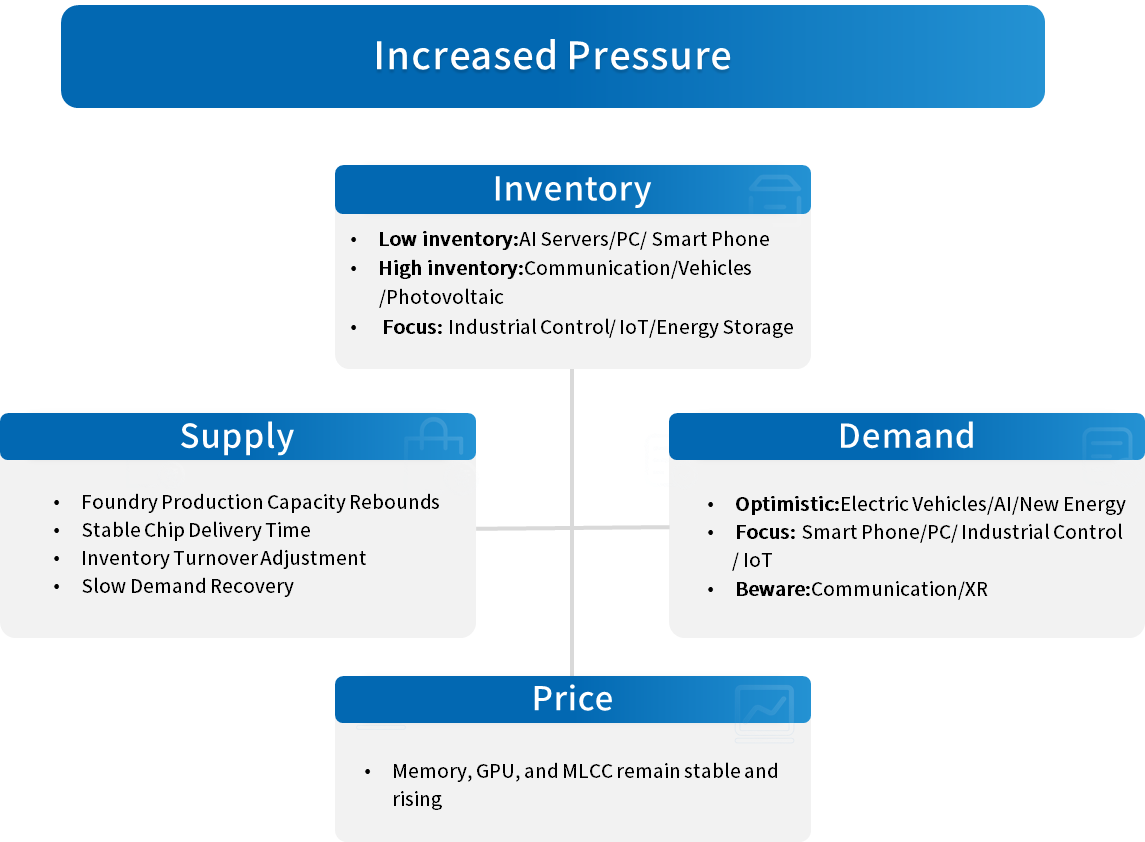
3 Orders and Inventory in August
4 Semiconductor Supply Chain in August
4.1 Semiconductor Upstream Manufacturers
(1)Silicon Wafer/Equipment
(2)Fabless/IDM
(3)Foundry
(4)OSAT
4.2 Distributor
4.3 System Integration
4.4 Terminal Application
(1)Consumer Electronics
(2)New Energy Vehicles
(3)Industrial Control
(4)Photovoltaic
(5)Energy Storage
(6)Server
(7)Communication
5 Distribution and Sourcing Opportunities and Risks
5.1 Opportunities
5.2 Risk
6 Summarize
Disclaimer
Prologue
1 Macroeconomics in August
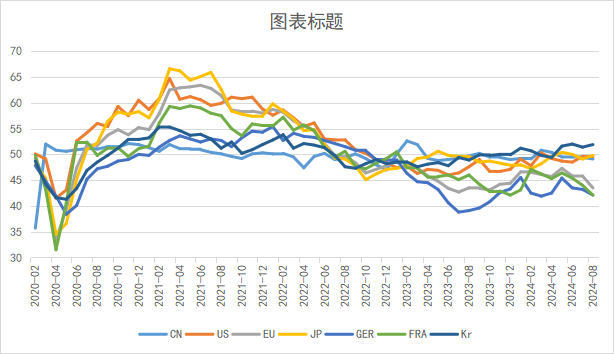
1.1 Global Manufacturing Pressure Continues
In August, the global manufacturing industry remained sluggish with sluggish growth. Specifically, the European Union, represented by China, the United States, Japan, Germany, and France, is still below the balance line of prosperity and decline. The market supply and demand have slightly slowed down, but the growth pressure has not decreased.
Chart 1: Manufacturing PMI of the world's major economies in August
Source: NBSPRC
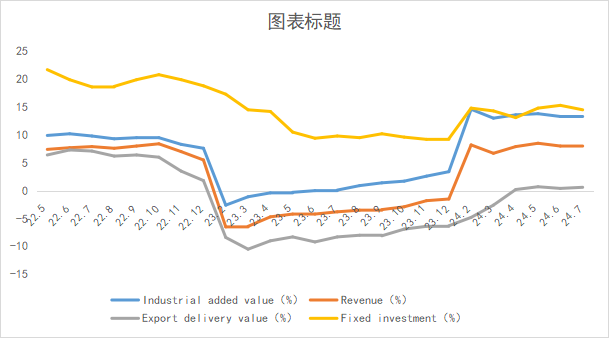
1.2 Stable Growth of Electronic Information Manufacturing Industry
From January to July 2024, the production of China's electronic information manufacturing industry grew rapidly, exports continued to rebound, efficiency steadily improved, investment remained high, and the overall development trend of the industry was good.
Chart 2: Latest Operation of Electronic Information Manufacturing Industry
Source: MIIT
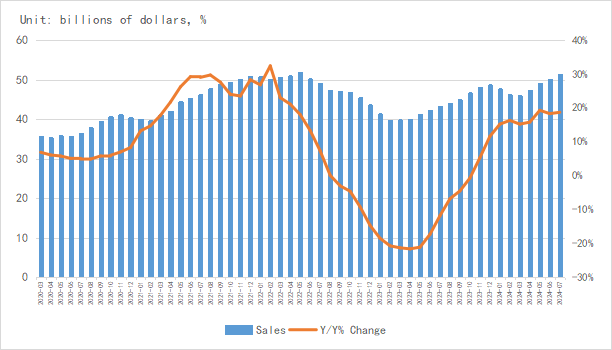
1.3 Optimistic Semiconductor Sales Trend
The SIA announced global semiconductor industry sales hit $51.3 billion during the month of July 2024, an increase of 18.7% compared to the July 2023 total of $43.2 billion and 2.7% more than the June 2024 total of $50.0 billion. Regionally, year-to-year sales were up in the Americas (40.1%), China (19.5%), and Asia Pacific/All Other (16.7%), but down in Japan (-0.8%) and Europe (-12.0%). Month-to-month sales in May increased in the Americas (4.3%), Asia Pacific/All Other (3.9%), Japan (3.3%), and China (0.9%), but decreased in Europe (-0.5%).
Chart 3: Latest global semiconductor industry sales and growth rate
Source: SIA,SEMI,Chip Insights
From the perspective of integrated circuit production, the global integrated circuit production in July was about 112.2 billion blocks, a year-on-year increase of 13.5%. China's production is about 37.54 billion yuan, a year-on-year increase of 26.9%. The integrated circuit industry is showing a vigorous upward trend, while also releasing signals of industry recovery.
Chart 4: Latest global and Chinese integrated circuit production and growth rate
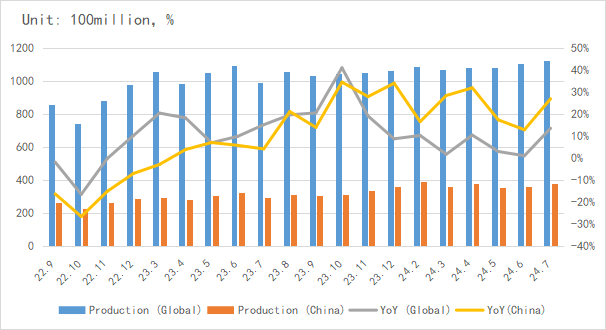
Source: NBSPRC,SIA,Chip Insights
In terms of imports and exports, China's integrated circuit imports and exports grew strongly in July, indicating that the Chinese integrated circuit industry is leading the global semiconductor market recovery under the rebound of terminal demand.
Chart 5: Latest import and export amount and growth rate of integrated circuits in China
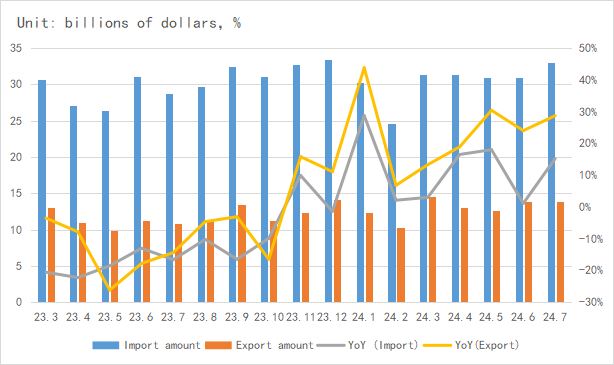
Source: MIIT,SIA,Chip Insights
According to the capital market index, the SOX rose by 6.2% in August, while the Chinese SW industry index fell by 9.8%. Investors are optimistic about the current semiconductor market expectations.
Chart 6: Trend of SOX and SW Index in August
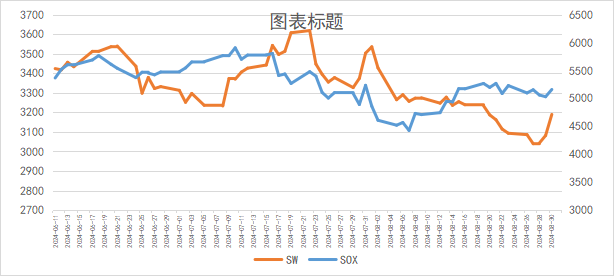
Source: Wind,Chip Insights
For more information, please refer to the attached report.