Electronic Components Sales Market Analysis and Forecast (October 2026)
1 Macroeconomic Overview
1.1 Global Manufacturing Expansion Slows, Divergence Intensifies
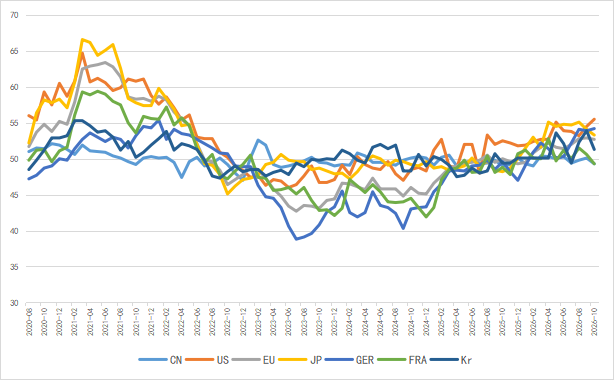
In October, the US and Germany maintained expansion. China saw a seasonal pullback amid structural adjustment while high-tech manufacturing remained active. France fell back into contraction, and growth in Japan and South Korea moderated, highlighting widening regional divergence.
Figure 1: Manufacturing PMI of Major Global Economies
Source: NBSPRC
1.2 Electronic Information Manufacturing Accelerates Growth with Improving Profitability
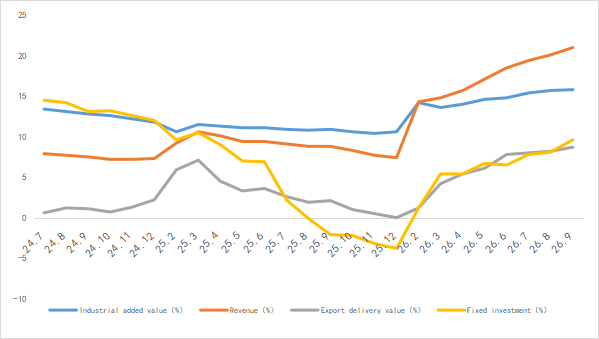
In the first three quarters of 2026, China’s electronic information manufacturing sector recorded rapid production growth, rising exports, robust profit gains and steady investment, with notable revenue divergence across regions.
Figure 2: Latest Operation of Electronic Information Manufacturing Industry
Source: MIIT
1.3 Semiconductor Sales Hit New Records
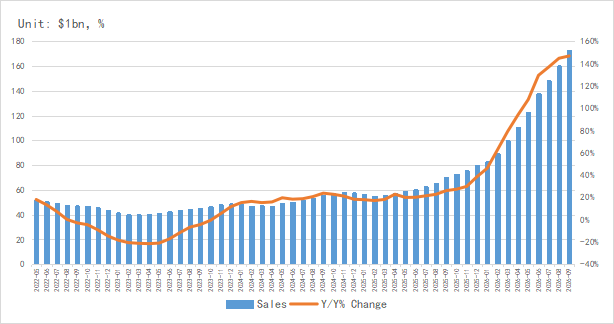
Per the latest SIA data, global semiconductor market sales reached USD 172.58 billion in September, up 146.8% YoY, marking the 19th consecutive month of sequential growth. Q3 2026 sales totalled USD 517.7 billion.
By region, the Americas rose 191.7% YoY, China 124.9% YoY, while Asia-Pacific, Japan and Europe registered 141.4%, 73.4% and 102.5% YoY growth respectively.
Figure 3: Global Semiconductor Industry Sales And Growth Rate
Source: SIA,Chip Insights
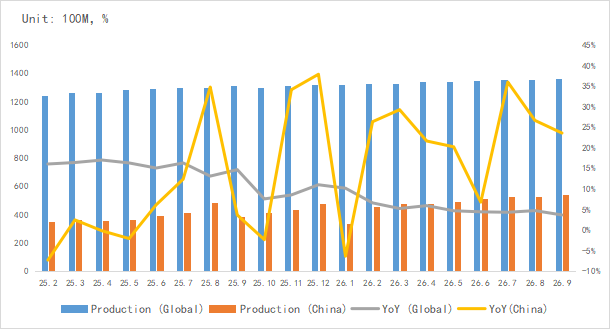
On IC output, global and China IC production stood at roughly 136.1 billion units and 54.27 billion units in September, with sustained supply expansion.
Figure 4: Global And China Integrated‑Circuit Output And Growth Rate
Source: WSTS,SIA,Chip Insights
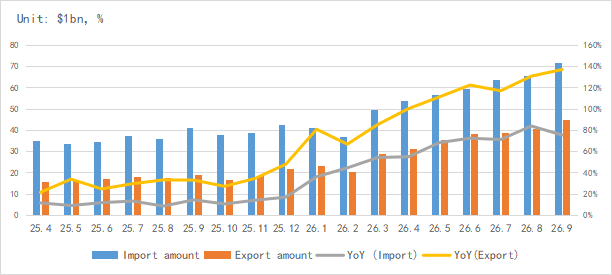
For trade, China’s IC imports and exports stayed strong in September. export growth exceeded 136%, reflecting deepening domestic substitution.
Figure 5: China Integrated‑Circuit Import & Export Value And Growth Rate
Source: MIIT,SIA,Chip Insights
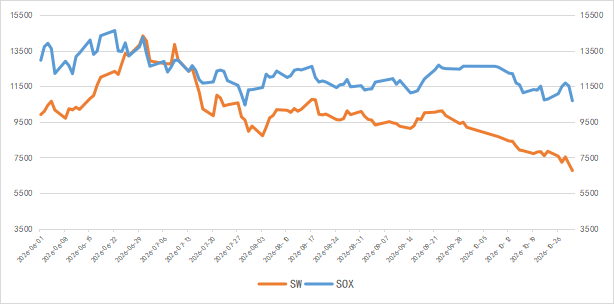
In capital markets, the Philadelphia Semiconductor Index (SOX) dropped 15.3% in October, and the China Semiconductor (SW) Index fell 22.5%. The pullback stemmed from prior sharp gains and valuation cooling from high levels.
Figure 6: Trend of SOX and SW Index in August
Source: Wind,Chip Insights
For more details, please download the full version of the report: