Electronic Components Sales Market Analysis and Forecast (September 2026)
Table Of Contents
Prologue
1 Macroeconomic Overview
1.1 Accelerated Expansion of Global Manufacturing
1.2 Rapid Growth & Stable Profitability of Electronic Information Manufacturing
1.3 SRobust Semiconductor Sales, Exceeding USD 1 Trillion in Total
2 Chip Lead Time Trends
2.1 Overall Chip Lead Time Trends
2.2 Overview of Lead Times for Key Chip Suppliers
3 Order And Inventory Conditions
4 Semiconductor Supply Chain
4.1 Upstream Semiconductor Players
(1)Silicon Wafer/Equipment
(2)Fabless/IDM
(3)Foundry
(4)OSAT
4.2 Distributor
4.3 System Integration
4.4 End‑Market Applications
(1)Consumer Electronics
(2)New Energy Vehicles
(3)Industrial Control
(4)Photovoltaic
(5)Energy Storage
(6)Data Center
(7)Communication
(8)Medical Equipment
5 Distribution and Sourcing Opportunities and Risks
5.1 Opportunities
5.2 Risk
6 Summarize
Disclaimer
Prologue
1 Macroeconomic Overview
1.1 Accelerated Expansion of Global Manufacturing
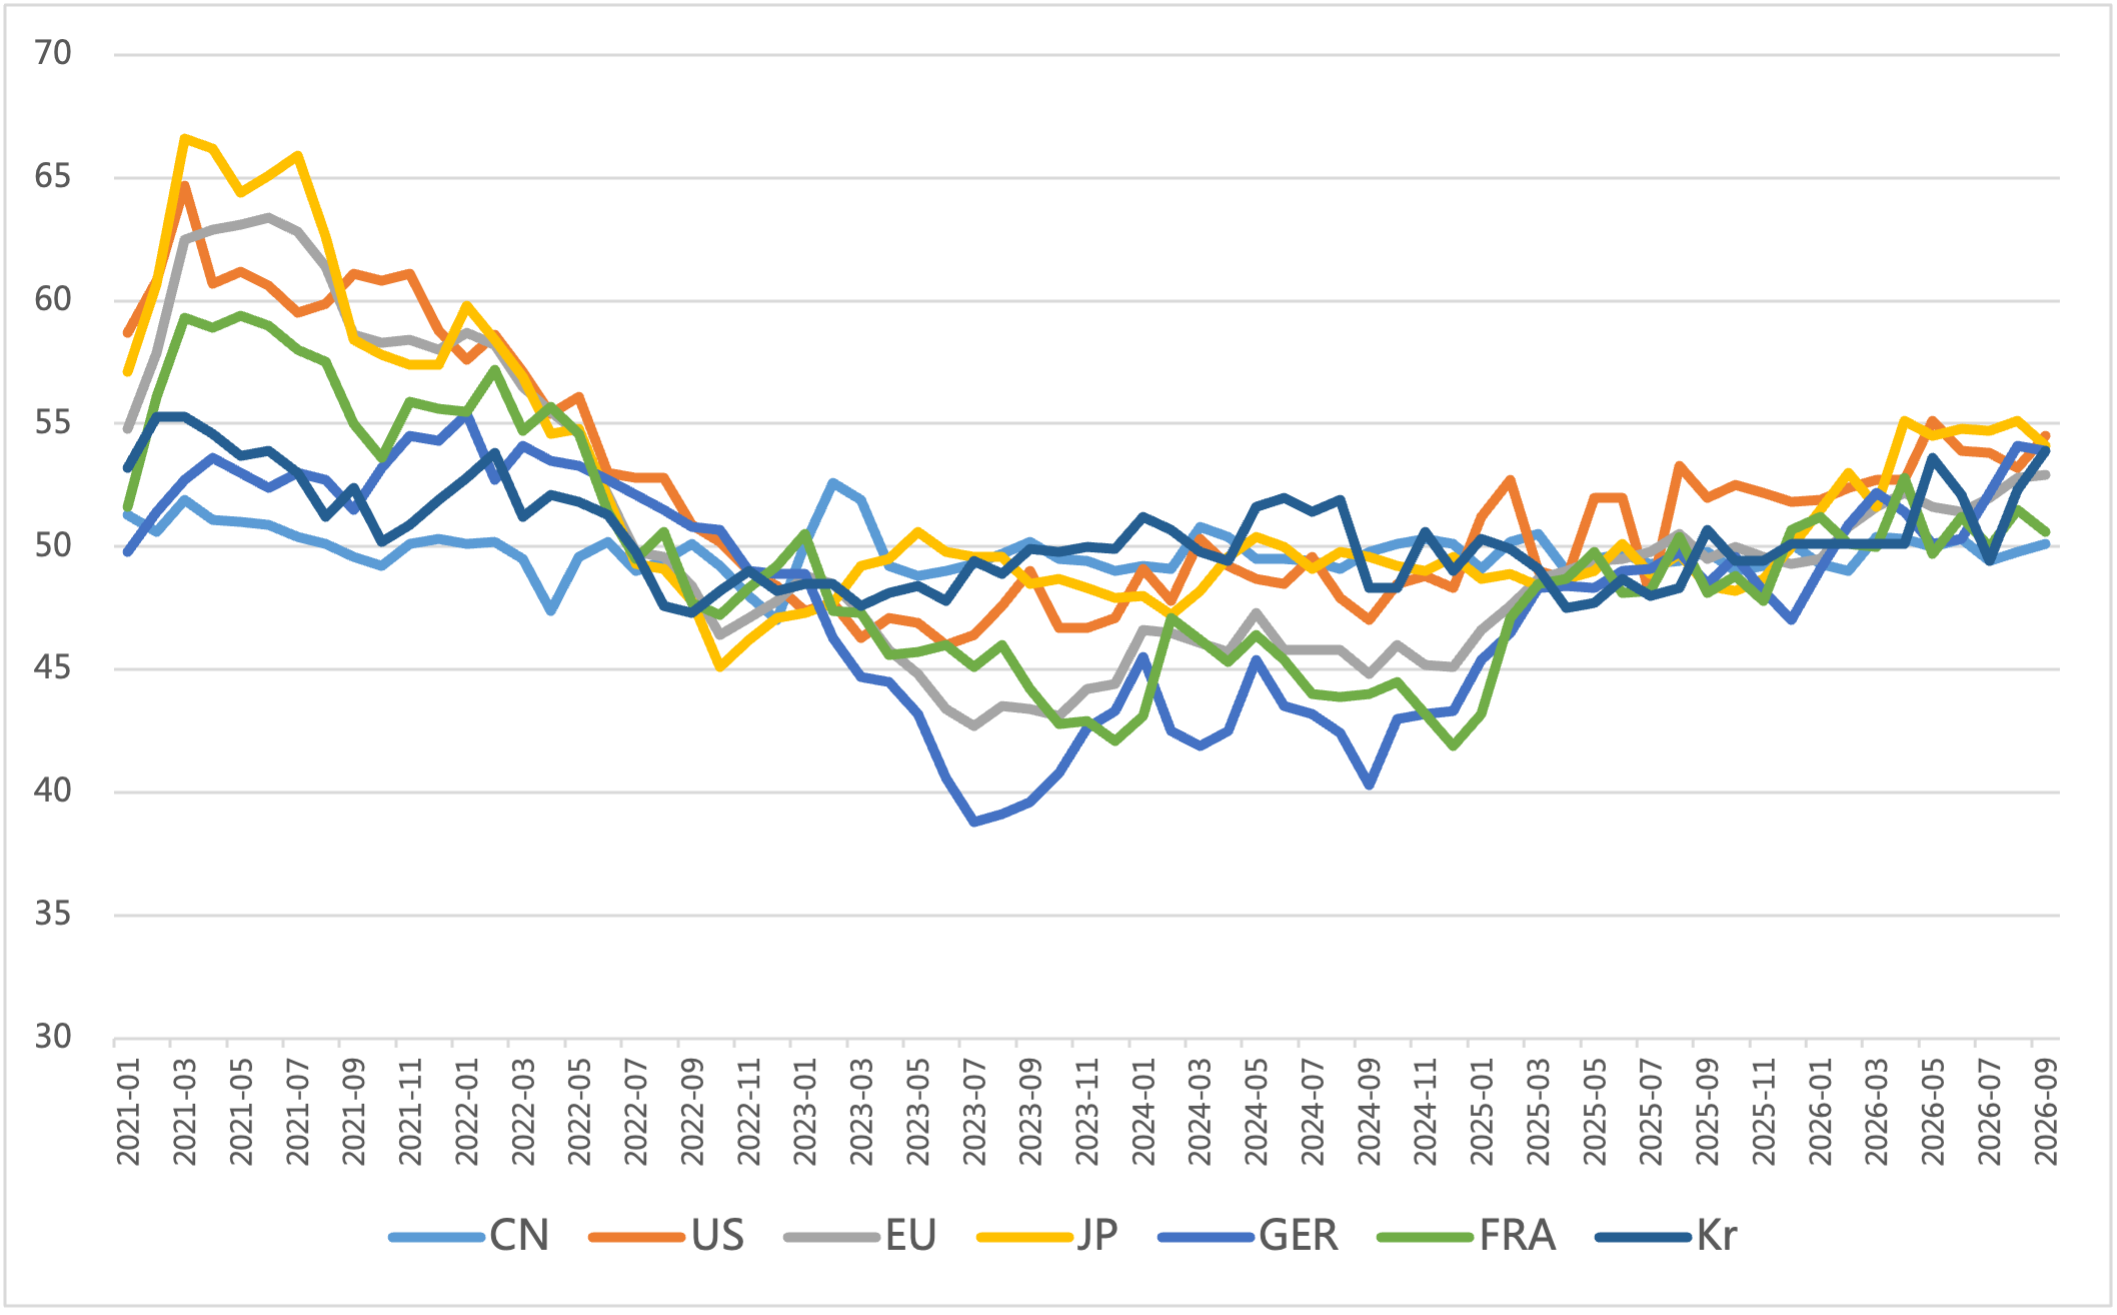
In September, the global manufacturing PMI rose to 53.0, hitting a 55-month high. Driven by the AI computing chain, the East Asian semiconductor economic belt represented by China, Japan and South Korea posted the strongest performance. The EU saw its first broad-based expansion in more than four years. However, cost pressures re-accumulated in the US and expansion momentum slowed in France. The balance of global manufacturing recovery remains to be seen.
Figure 1: Manufacturing PMI of Major Global Economies
Source: NBSPRC
1.2 Rapid Growth & Stable Profitability of Electronic Information Manufacturing
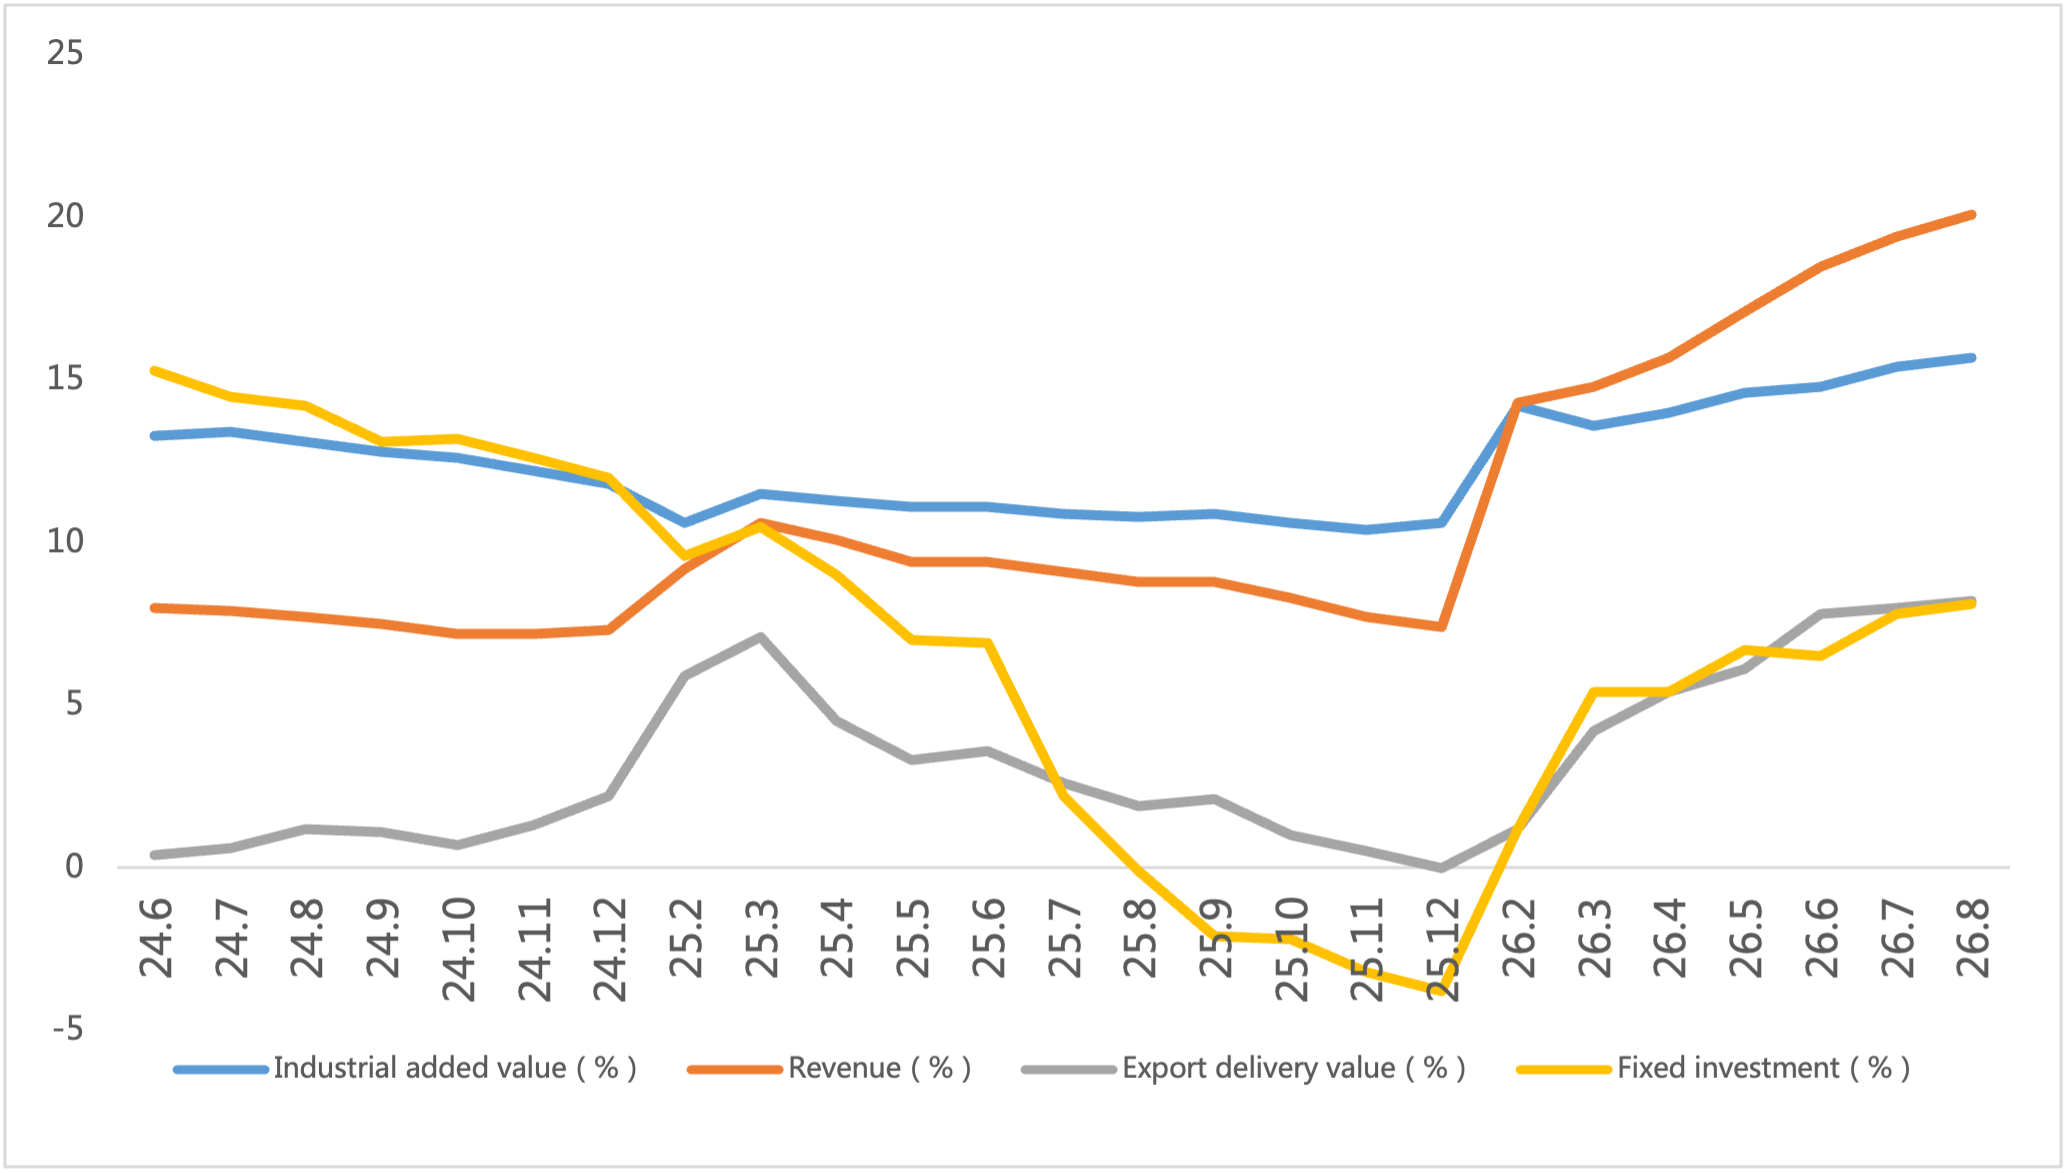
From January to August 2026, China’s electronic information manufacturing industry achieved rapid production growth with rising exports, solid improvement in operating benefits and steady investment expansion. The sector maintained a sound overall development trend.
Figure 2: Latest Operation of Electronic Information Manufacturing Industry
Source: MIIT
1.3 SRobust Semiconductor Sales, Exceeding USD 1 Trillion in Total
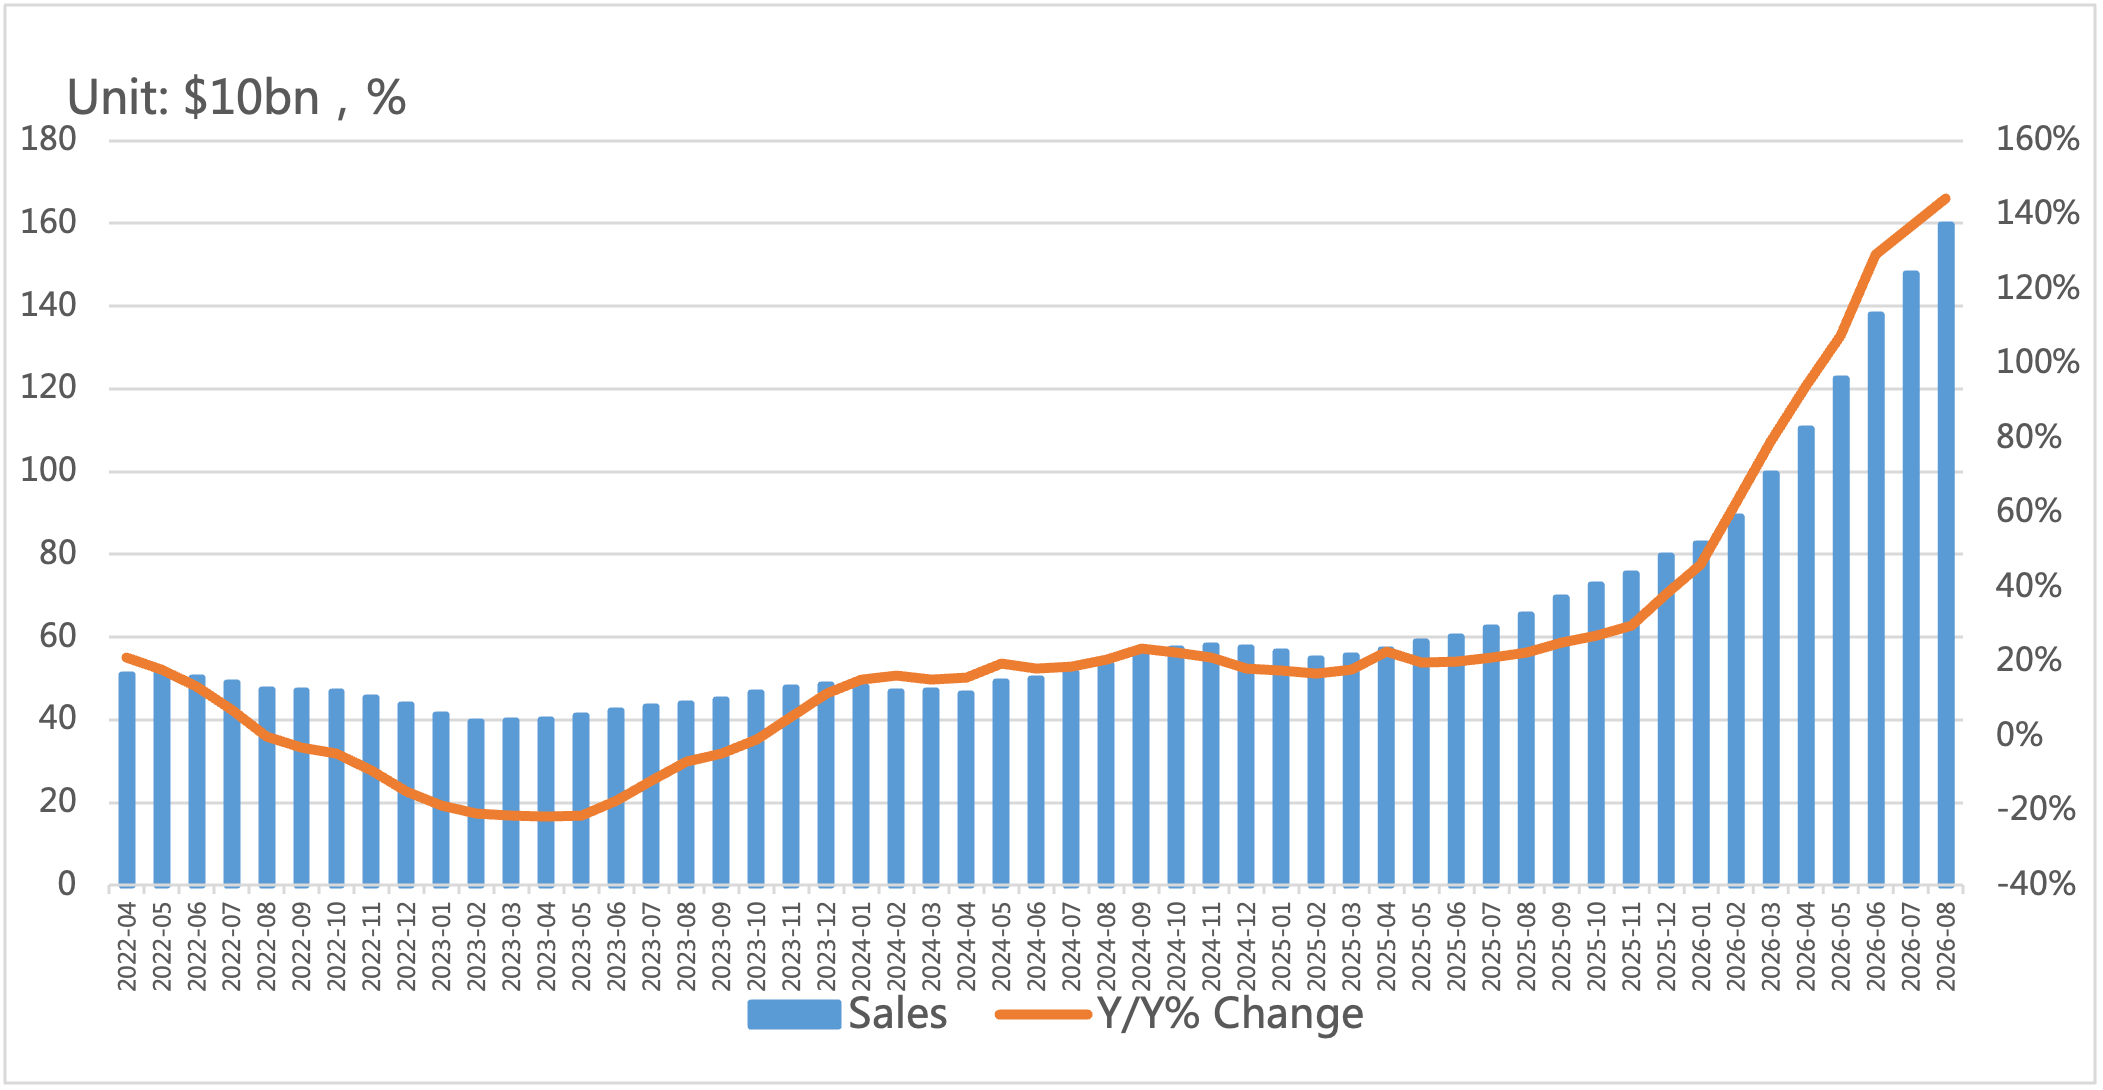
Per the latest SIA data, global semiconductor market sales reached USD 159.74 billion in August, up 144.3% YoY and marking the 18th consecutive month of month-on-month growth. Total sales from January to August surpassed USD 1 trillion.
By region, the Americas market rose 180.9% YoY and China market increased 131.3% YoY. Sales in Asia-Pacific, Japan and Europe grew by 143.0%, 62.3% and 98.5% respectively. The Americas, Asia-Pacific and China markets fueled continuous expansion of the global semiconductor industry.
Figure 3: Global Semiconductor Industry Sales And Growth Rate
Source: SIA,Chip Insights
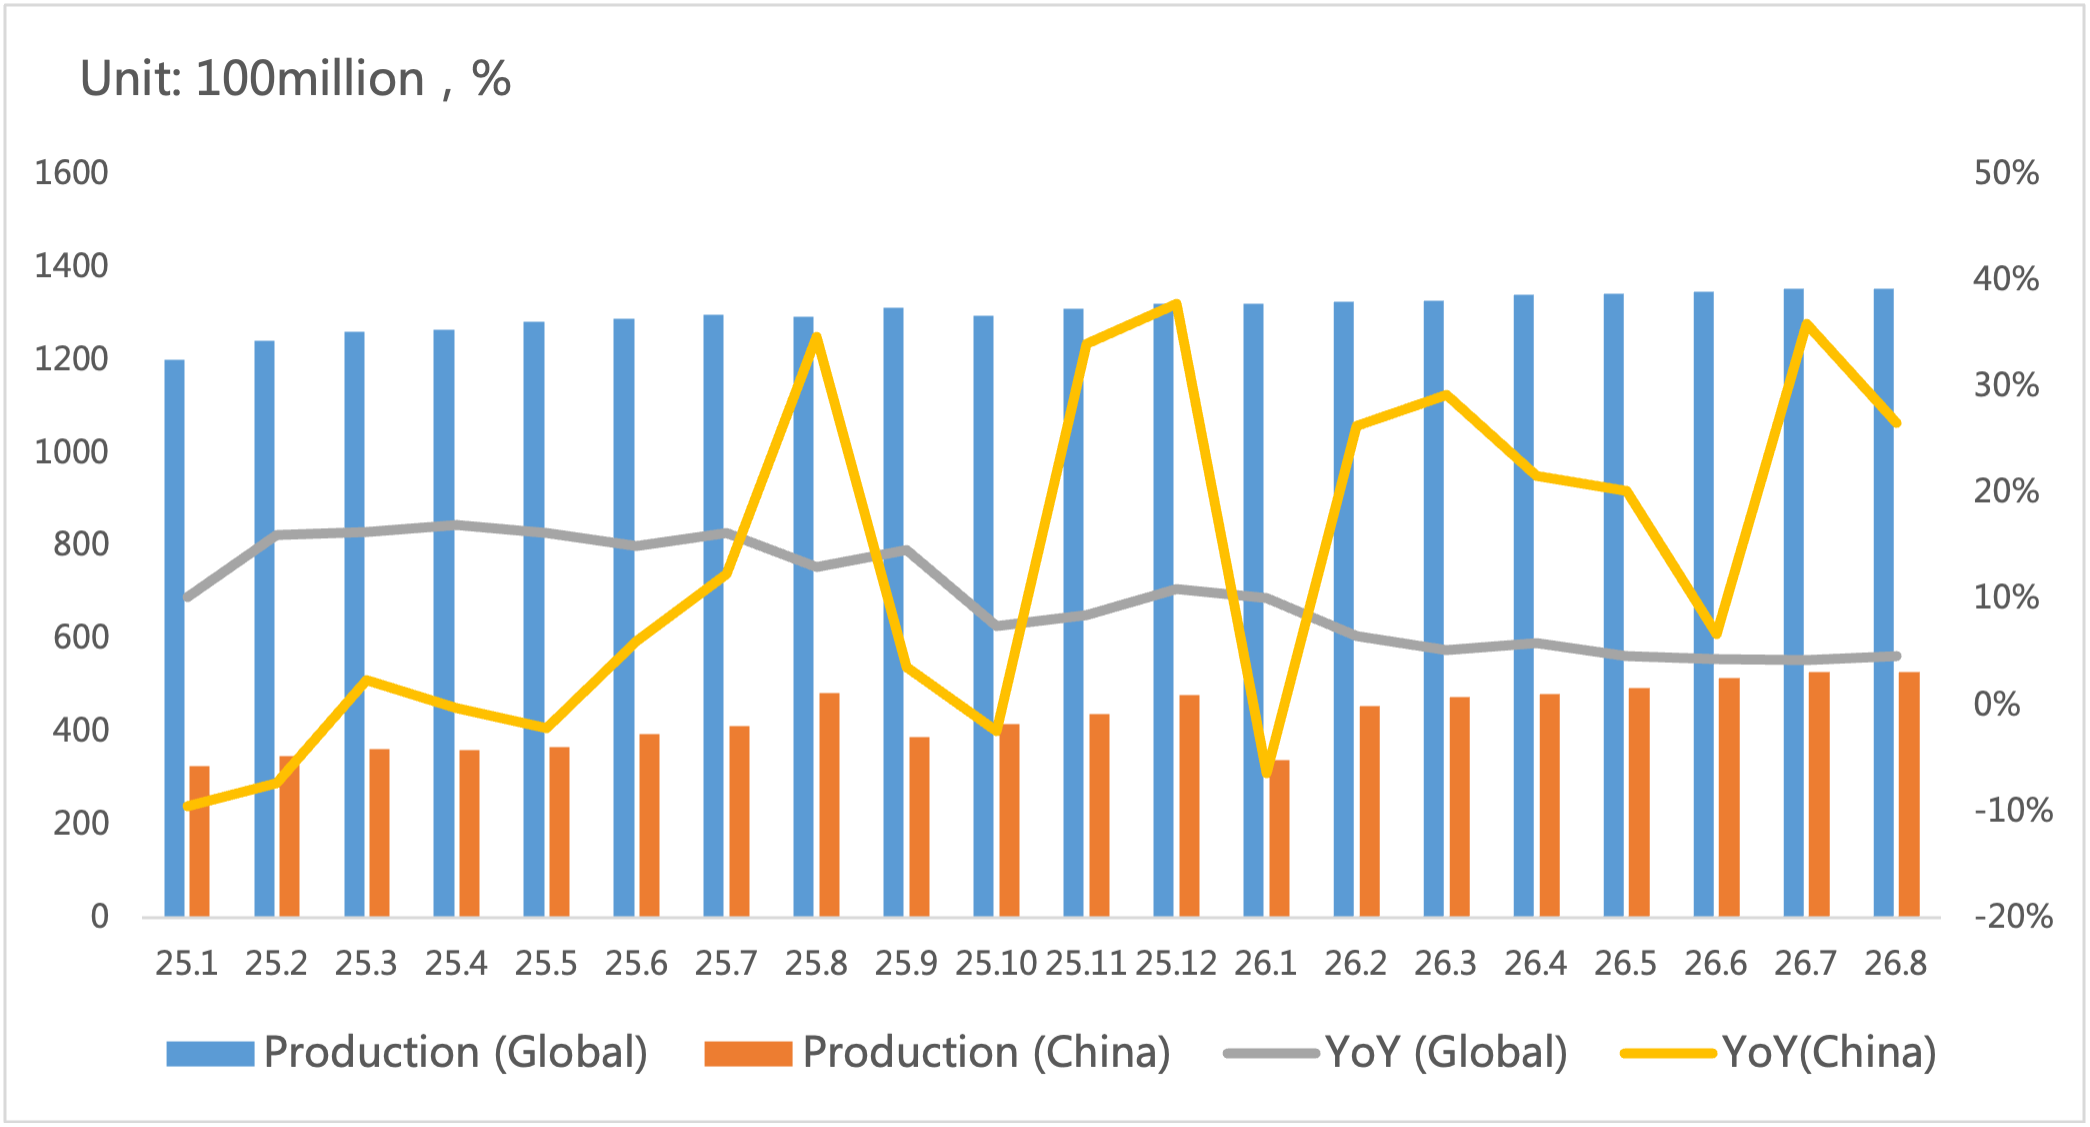
In terms of IC output, global and China IC production reached approximately 135.6 billion units and 52.9 billion units respectively in August. China’s production capacity kept expanding.
Figure 4: Global And China Integrated‑Circuit Output And Growth Rate
Source: WSTS,SIA,Chip Insights
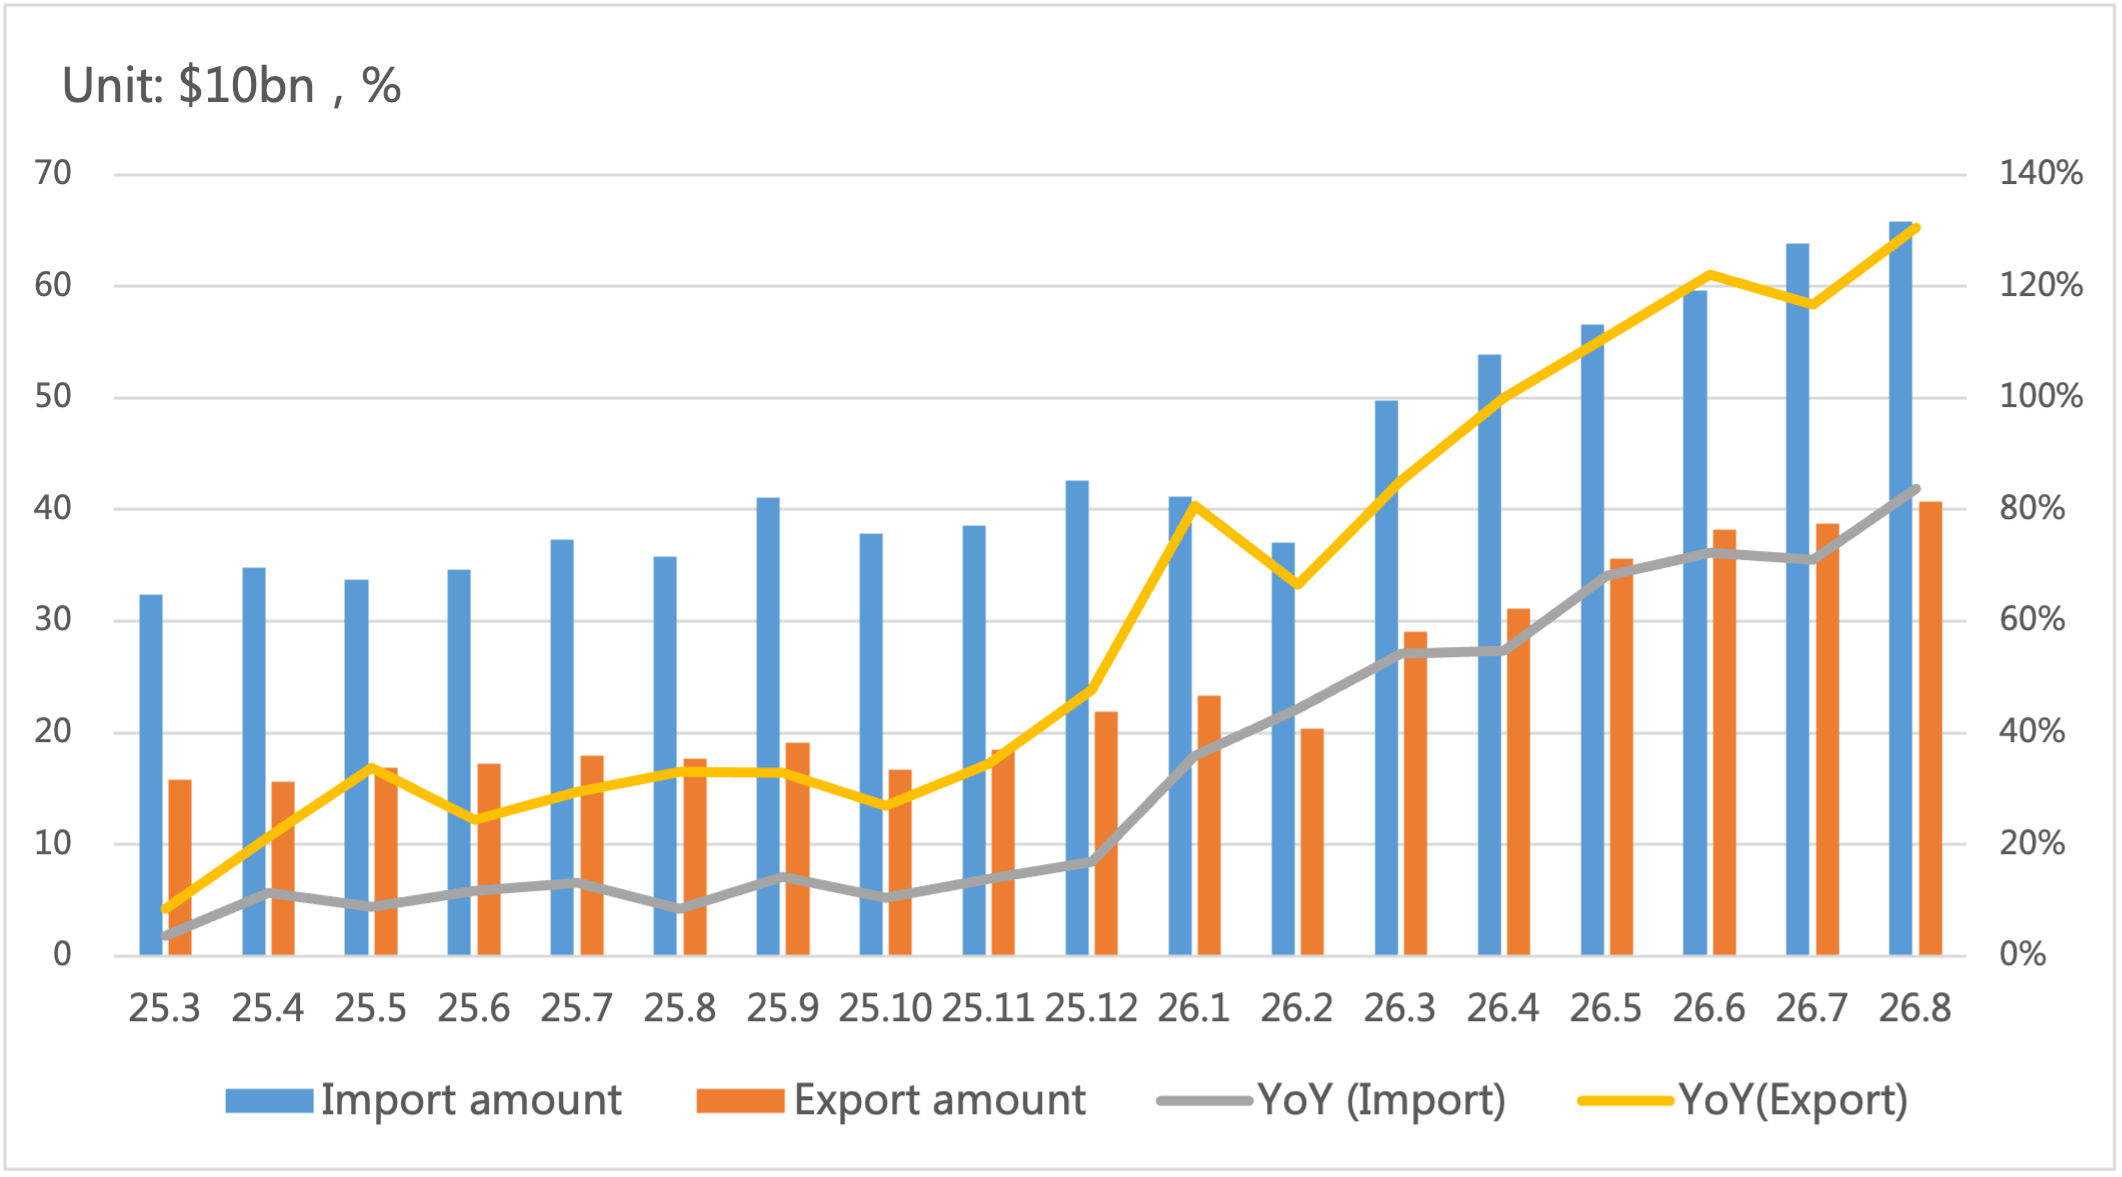
On import and export, China’s IC trade remained strong in August with export growth exceeding 130%. The product mix continued to upgrade toward high value-added products.
Figure 5: China Integrated‑Circuit Import & Export Value And Growth Rate
Source: MIIT,SIA,Chip Insights
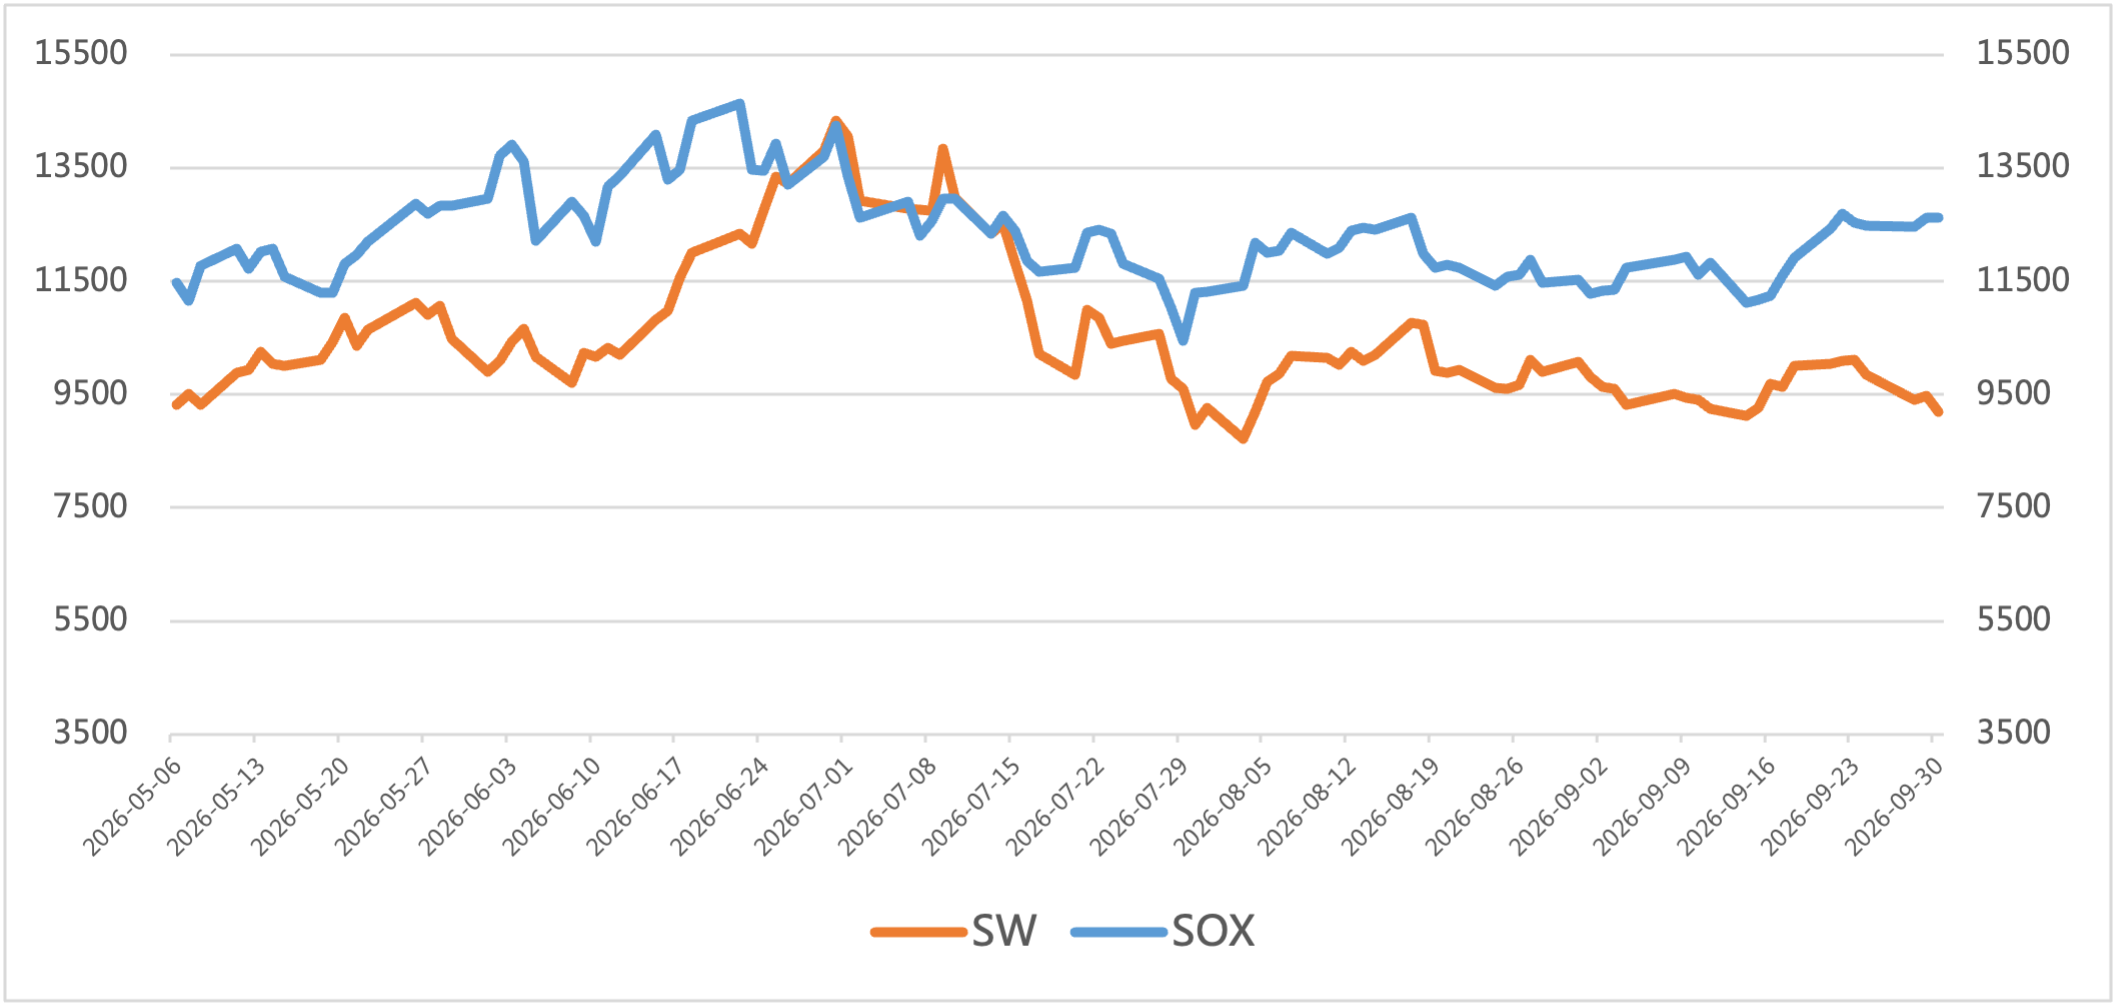
For capital market indices, boosted by strong AI demand and improved macro expectations, the Philadelphia Semiconductor Index (SOX) rose by 11.9% in September. Affected by liquidity and policy expectations, China Semiconductor (SW) Index fell 6.3%.
Figure 6: Trend of SOX and SW Index in September
Source: Wind,Chip Insights
For more information, please refer to the attached report.
Electronic Components Sales Market Analysis and Forecast (September 2026)