Electronic Components Sales Market Analysis and Forecast (August 2026)
Table Of Contents
Prologue
1 Macroeconomic Overview
1.1 Global Manufacturing Shows Signs Of Recovery With Sustained Marginal Improvement
1.2 Electronic Information Manufacturing Sees Surge In Profitability And Rising Investment
1.3 Semiconductor Sales Maintain Strong Growth And Hit Fresh All Time Highs
2 Chip Lead Time Trends
2.1 Overall Chip Lead Time Trends
2.2 Overview of Lead Times for Key Chip Suppliers
3 Order And Inventory Conditions
4 Semiconductor Supply Chain
4.1 Upstream Semiconductor Players
(1)Silicon Wafer/Equipment
(2)Fabless/IDM
(3)Foundry
(4)OSAT
4.2 Distributor
4.3 System Integration
4.4 End‑Market Applications
(1)Consumer Electronics
(2)New Energy Vehicles
(3)Industrial Control
(4)Photovoltaic
(5)Energy Storage
(6)Data Center
(7)Communication
(8)Medical Equipment
5 Distribution and Sourcing Opportunities and Risks
5.1 Opportunities
5.2 Risk
6 Summarize
Disclaimer
Prologue
1 Macroeconomic Overview
1.1 Global Manufacturing Shows Signs Of Recovery With Sustained Marginal Improvement
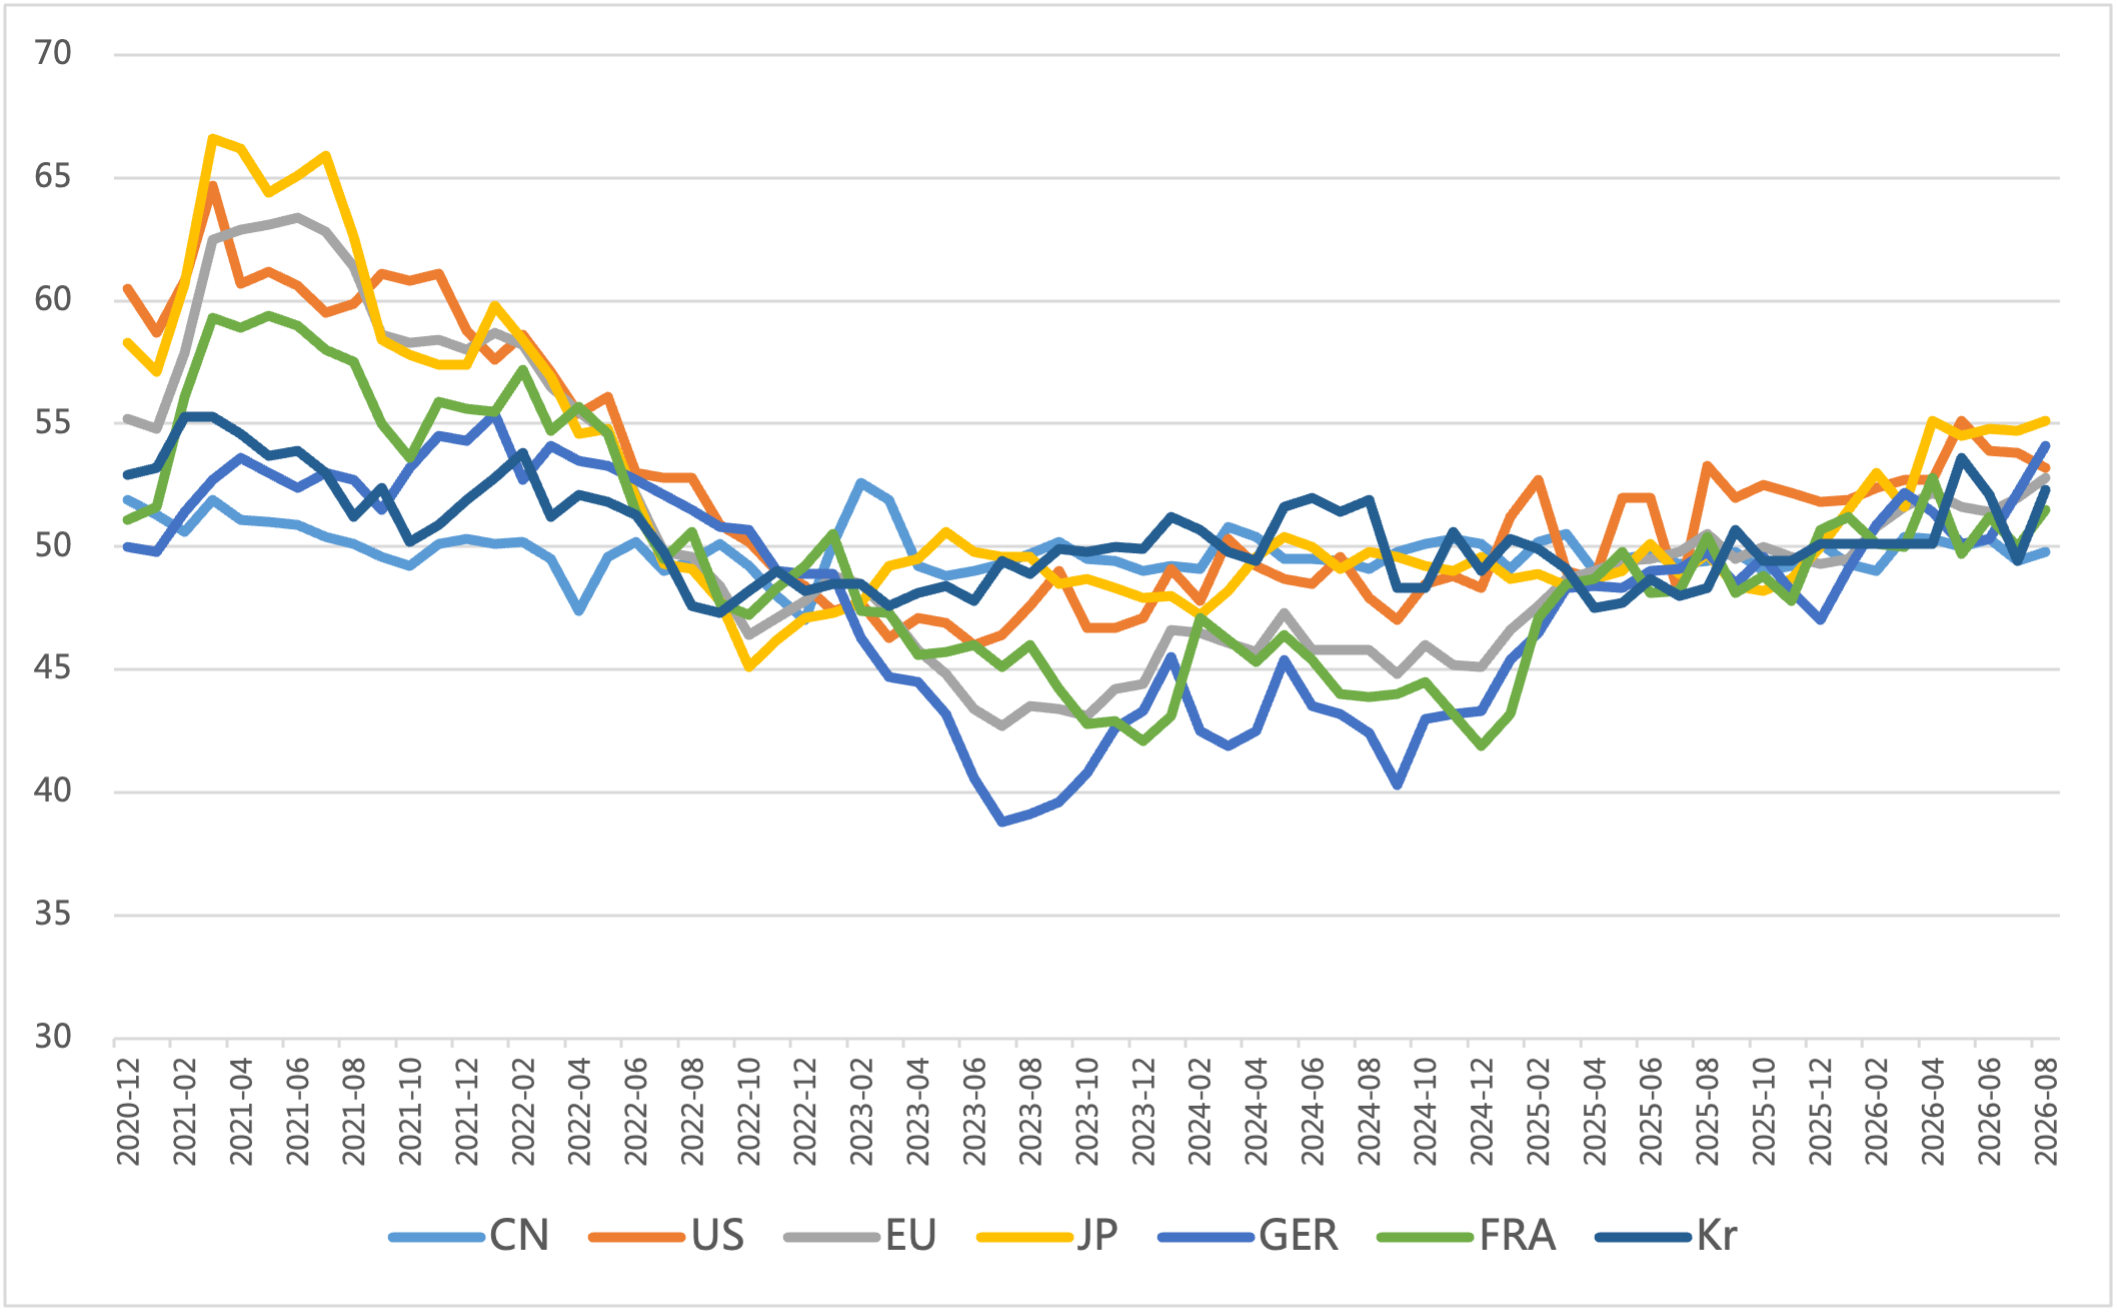
In August, the global manufacturing PMI rose to 52.3, staying above the boom‑bust line for the 13th consecutive month. Output, new orders and employment metrics improved simultaneously. Japan (55.1) and Germany (54.1) led the upturn.U.S. manufacturing slipped, while its services sector hit a 52‑month high. China (49.8) remained in contraction for five straight months yet saw marginal improvement. Germany posted robust recovery within Europe, and the AI computing‑power chain acts as the core driving force behind global manufacturing rebound.
Figure 1: Manufacturing PMI of Major Global Economies
Source: NBSPRC
1.2 Electronic Information Manufacturing Sees Surge In Profitability And Rising Investment
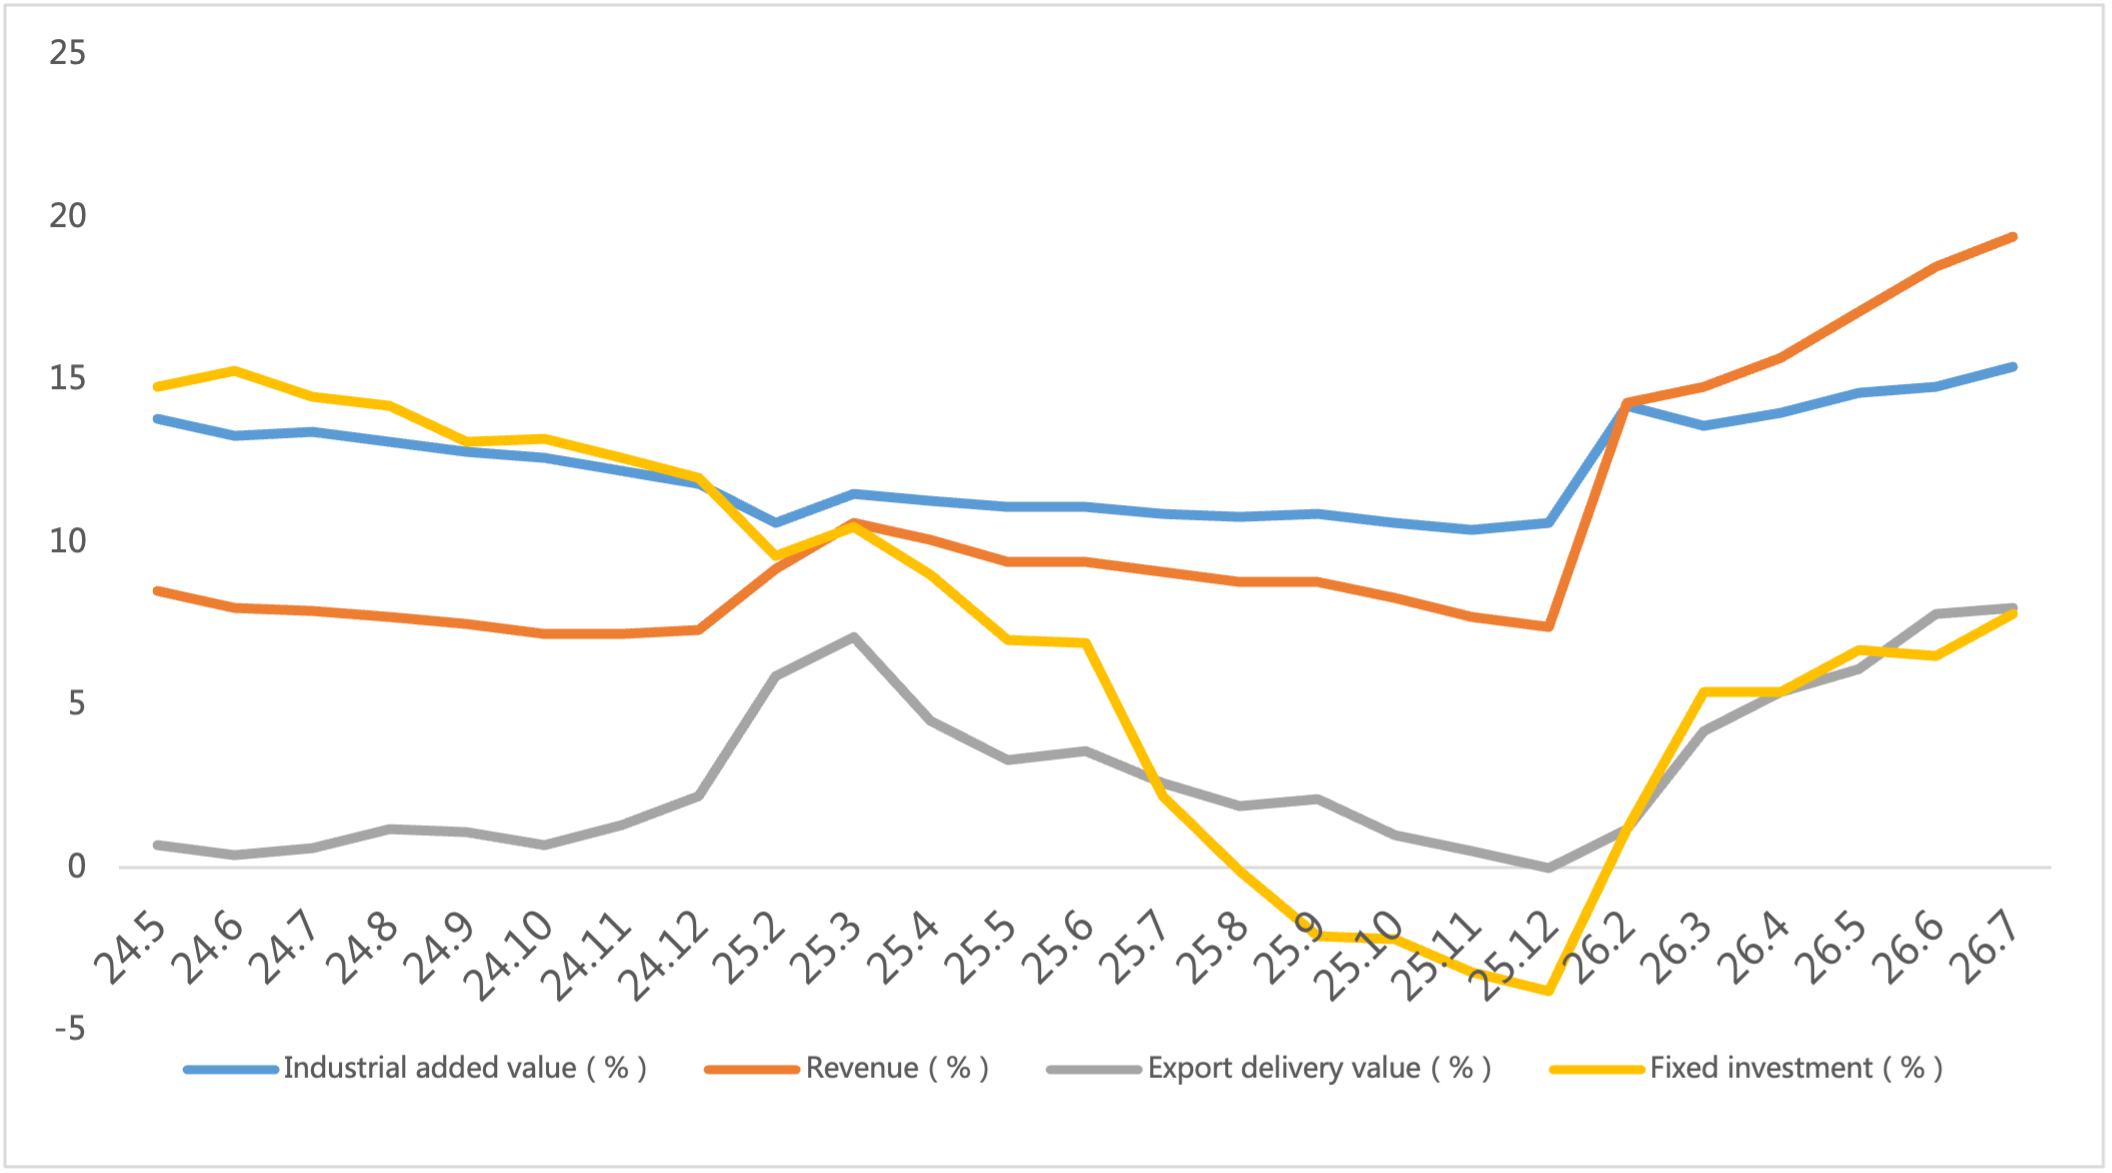
From January to July 2026, China’s electronic information manufacturing industry maintained rapid production growth. Export growth climbed steadily, industry profitability expanded sharply and investment picked up markedly, pointing to sound overall industry momentum.
Figure 2: Latest Operation of Electronic Information Manufacturing Industry
Source: MIIT
1.3 Semiconductor Sales Maintain Strong Growth And Hit Fresh All Time Highs
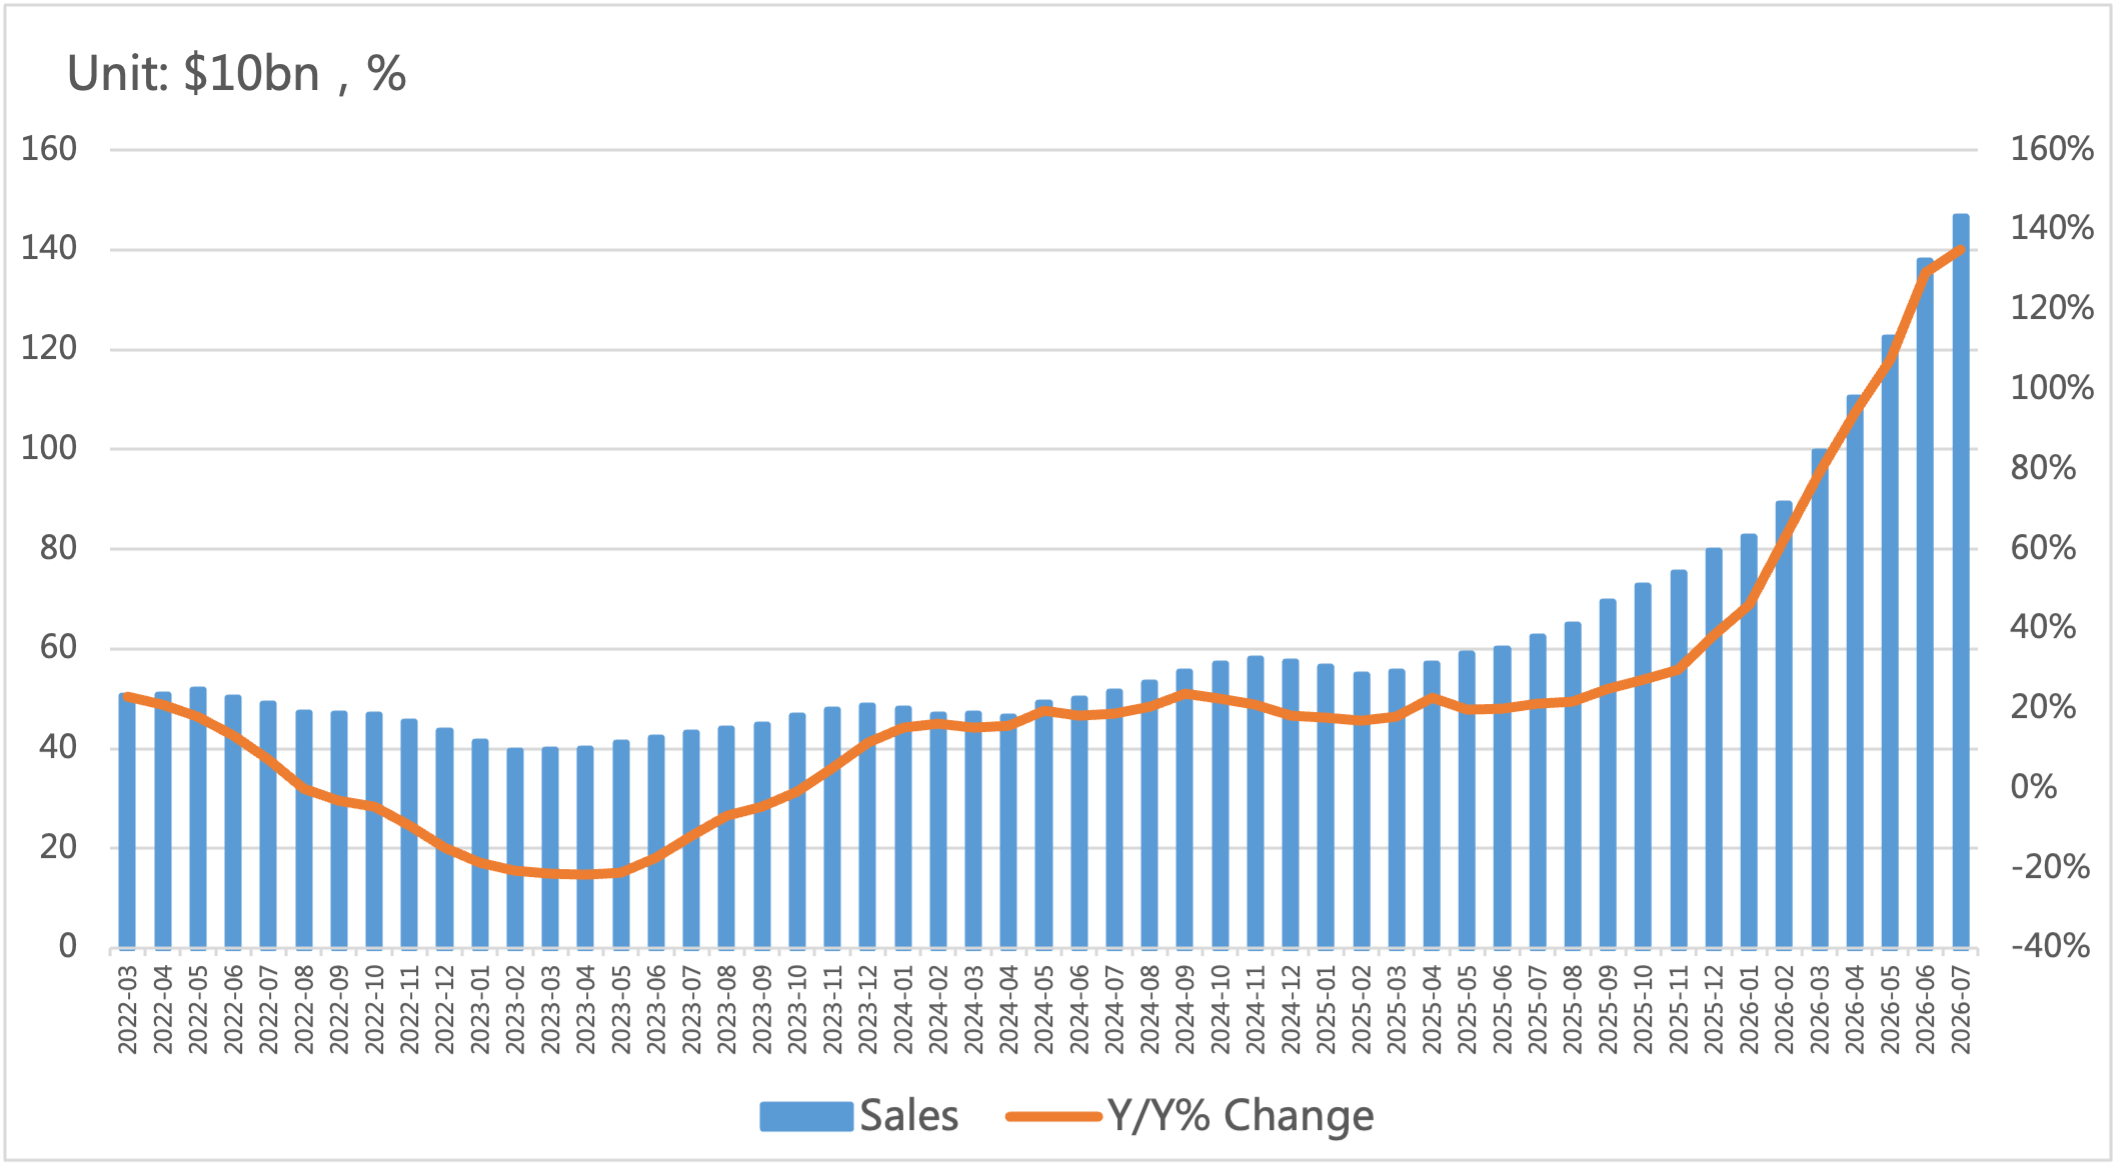
Per the latest SIA statistics, global semiconductor market sales reached USD 146.80 billion in July, surging 135.1% year on year. It marked the 17th consecutive month of quarter on quarter growth, and cumulative sales over the first seven months set an all time record for any year.
By regional market, the Americas posted 171.3% YoY growth, China registered 123.6% YoY growth. Sales in Asia Pacific, Japan and Europe rose 134.9%, 50.8% and 85.2% respectively. The Americas, Asia Pacific and China drove global market expansion.
Figure 3: Global Semiconductor Industry Sales And Growth Rate
Source: SIA,Chip Insights
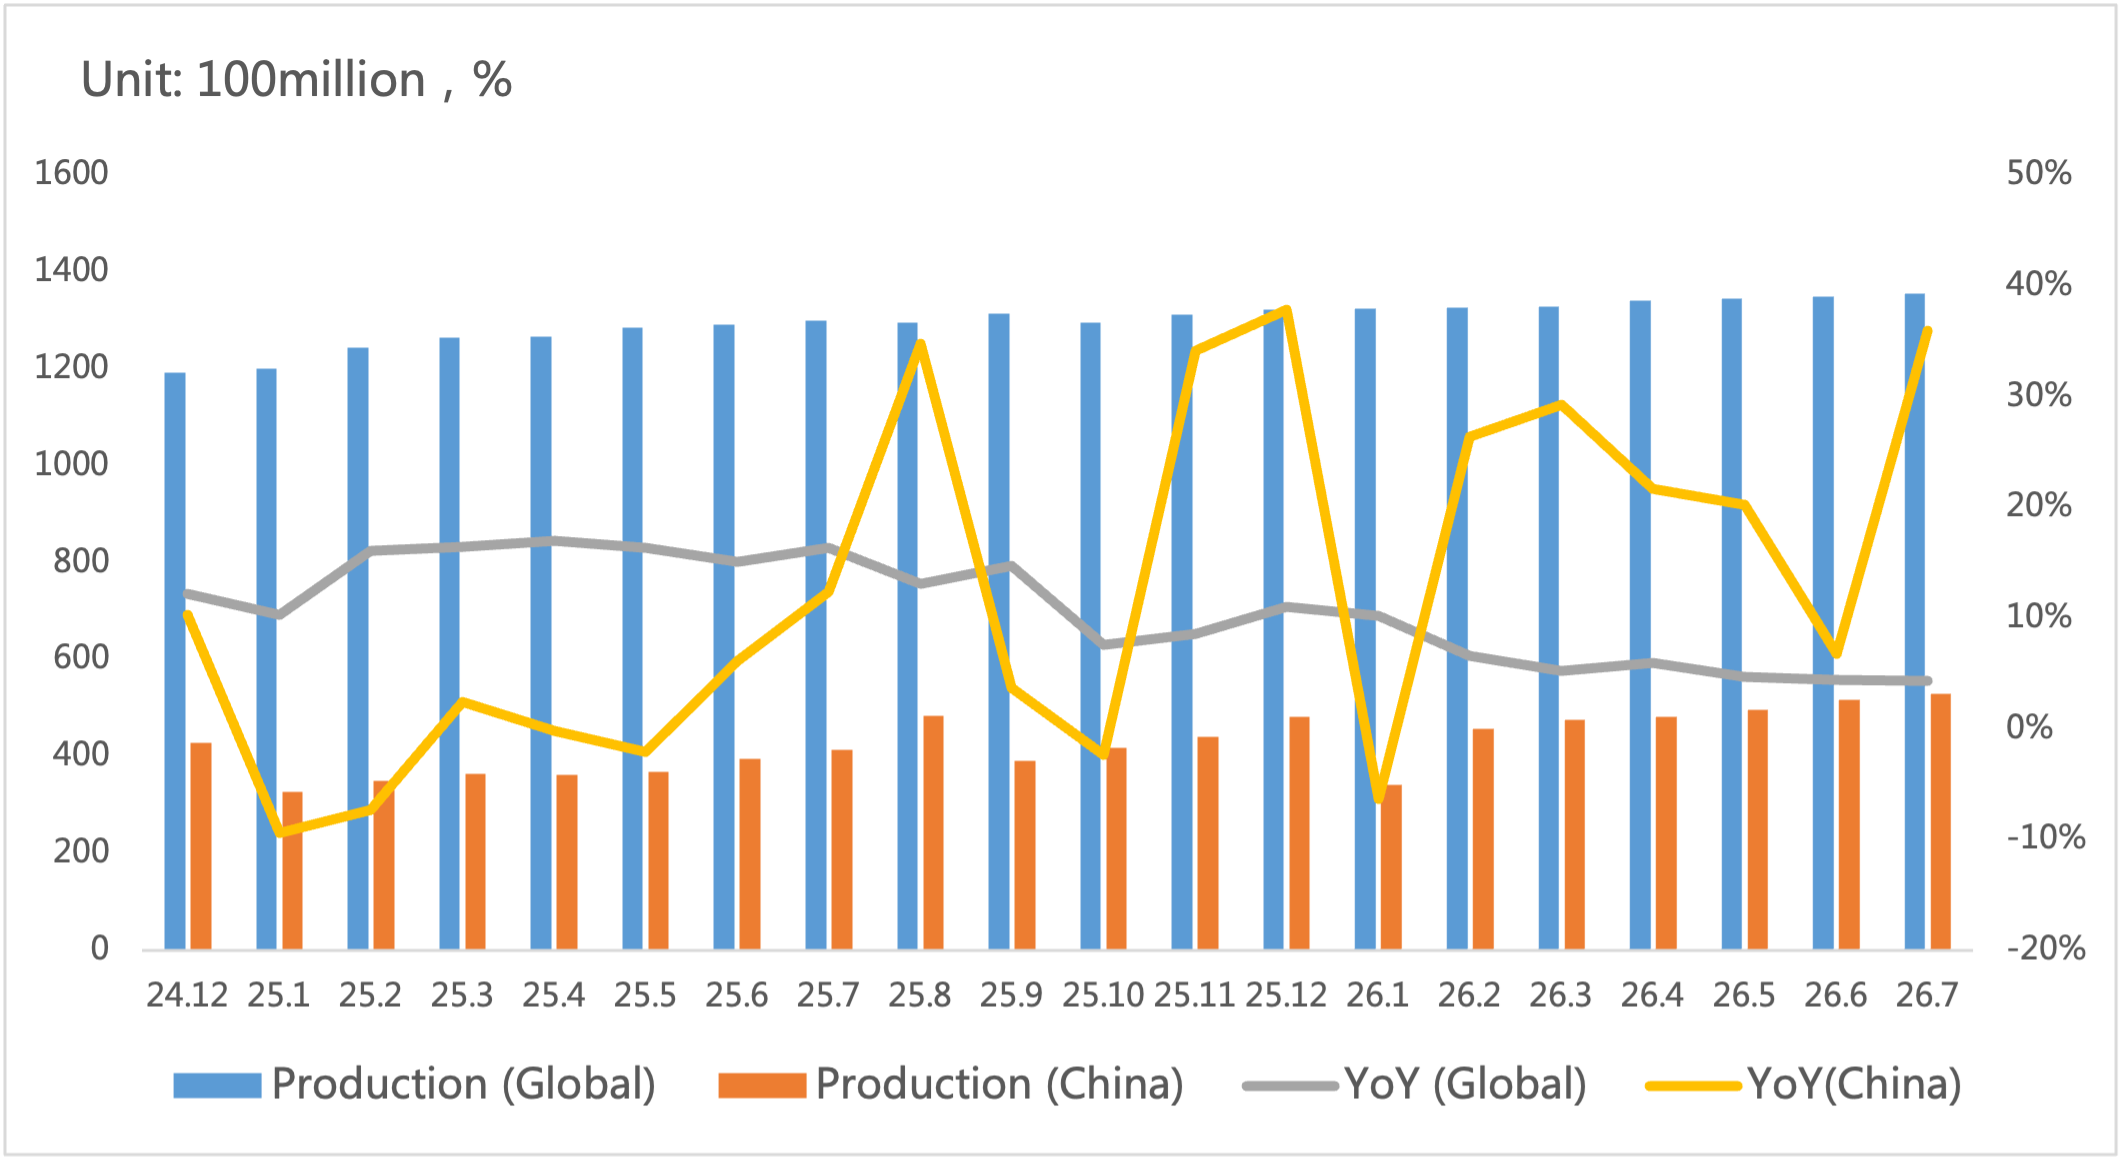
In terms of IC output, global and China’s integrated circuit output exceeded 135.5 billion units and 52.9 billion units respectively in July.
Figure 4: Global And China Integrated‑Circuit Output And Growth Rate
Source: WSTS,SIA,Chip Insights
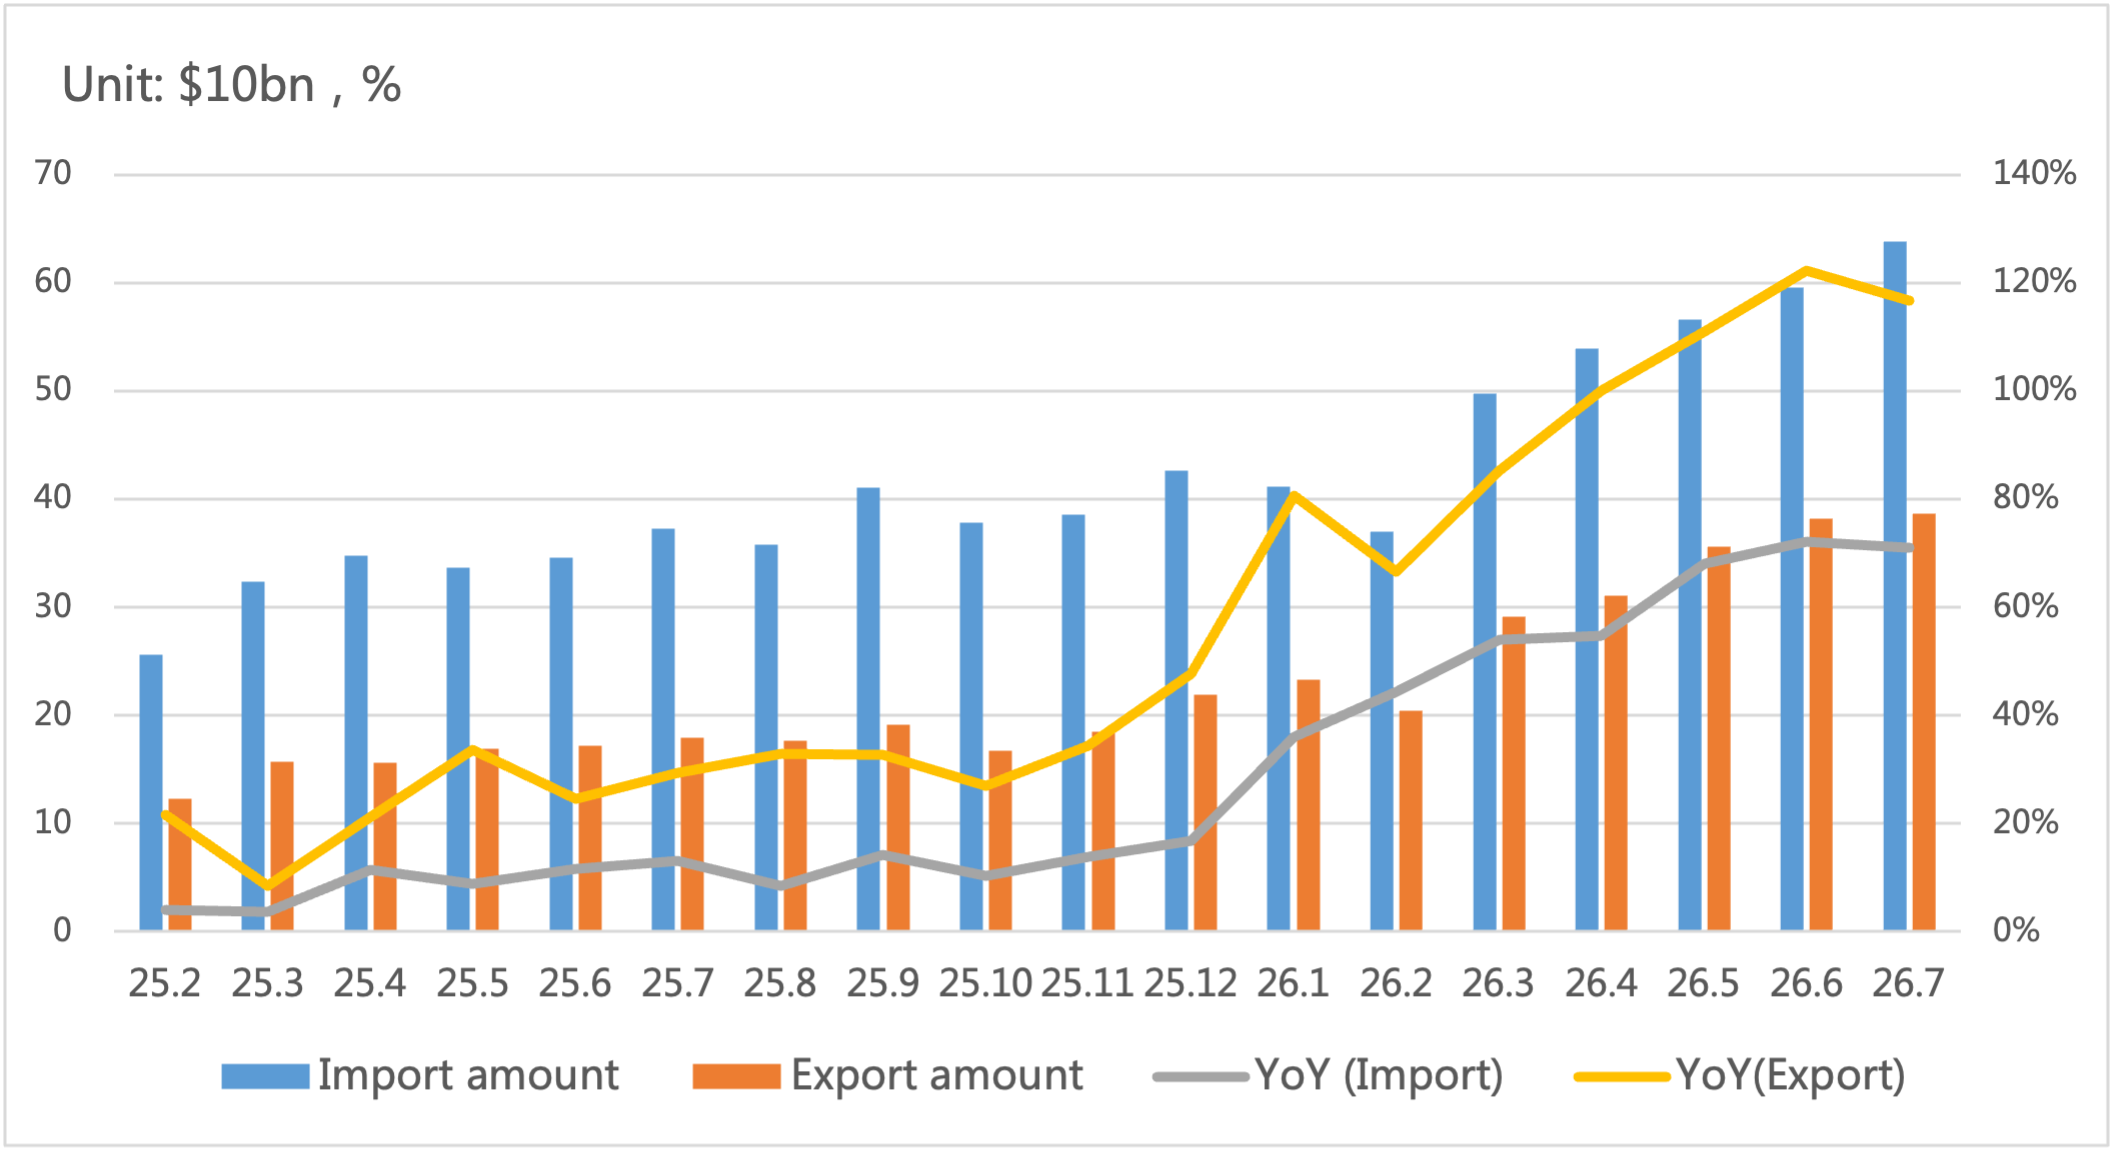
On import‑export front, China’s IC trade stayed robust in July, with export growth exceeding 111% for three successive months.
Figure 5: China Integrated‑Circuit Import & Export Value And Growth Rate
Source: MIIT,SIA,Chip Insights
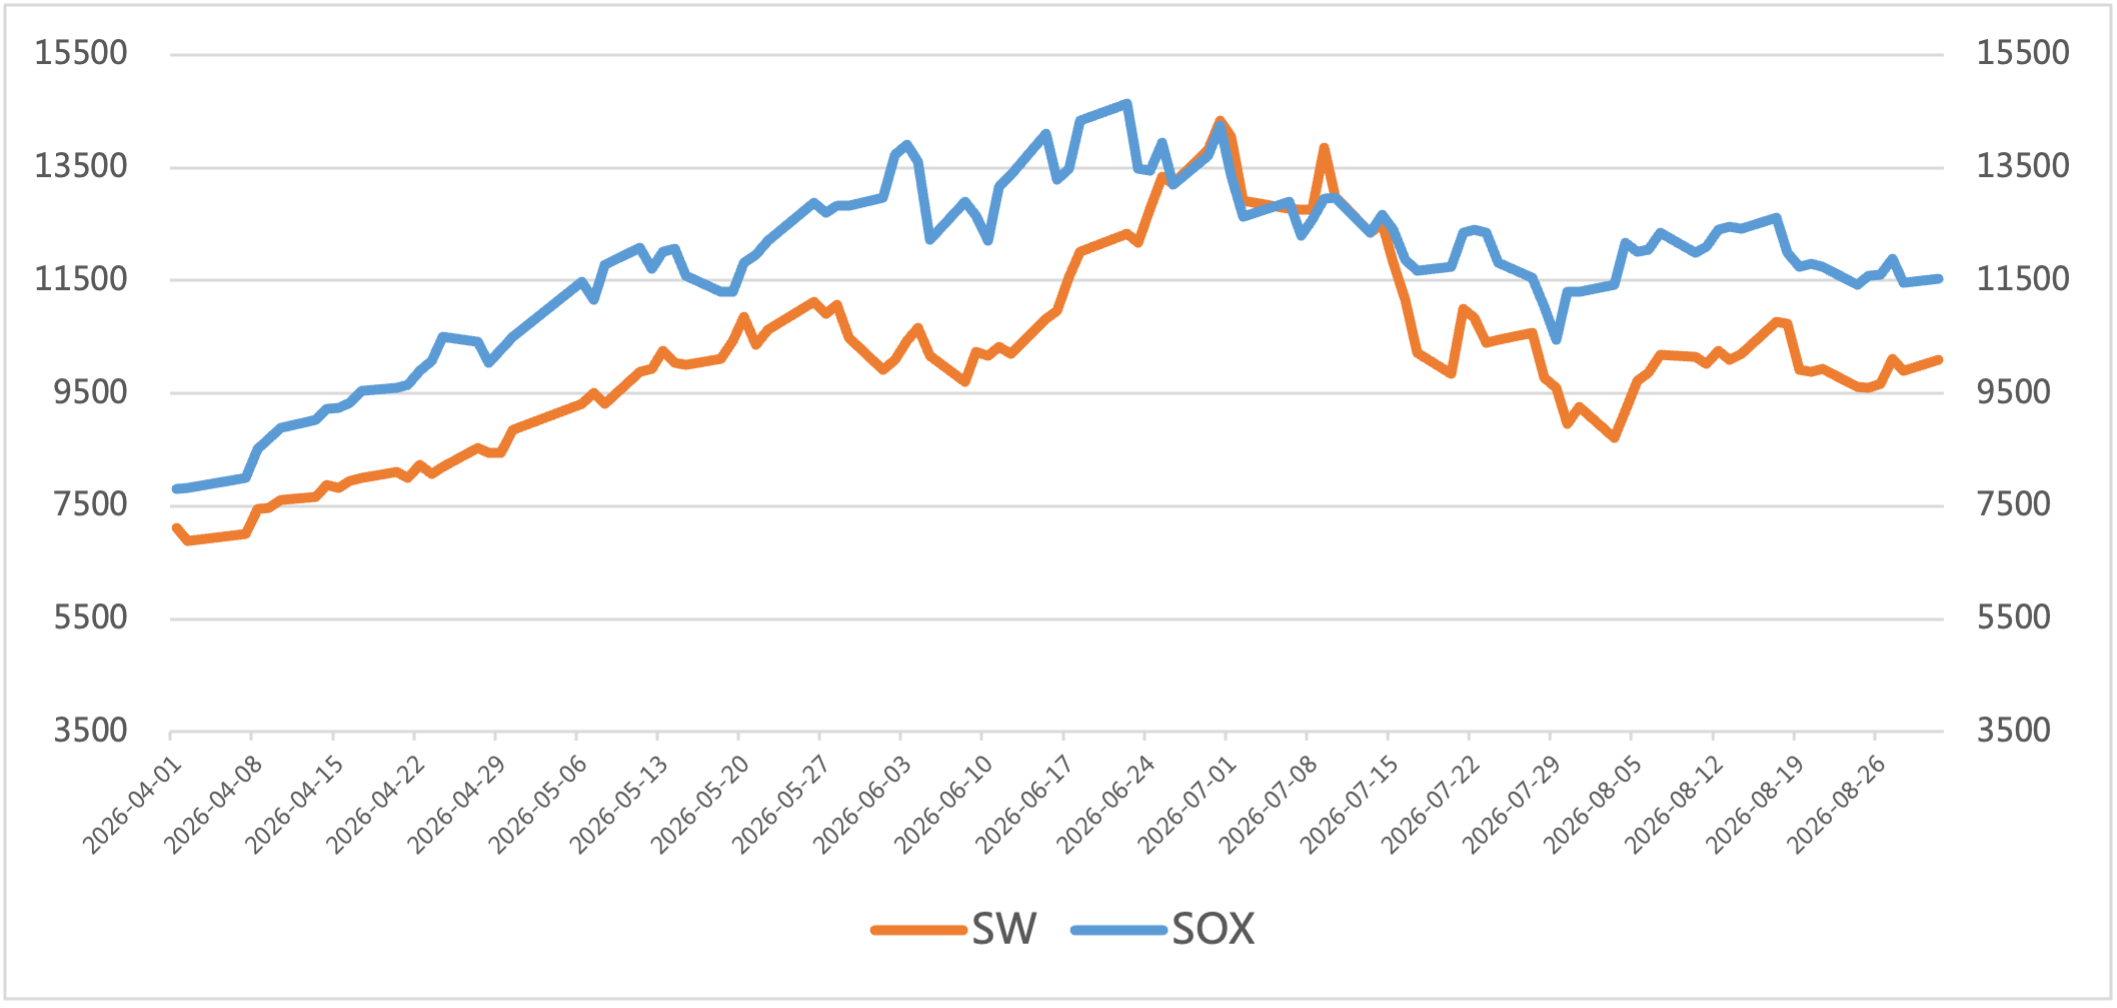
For capital‑market indices, fueled by AI computing‑power demand and earnings validation during reporting season, the Philadelphia Semiconductor Index (SOX) climbed 0.9%, while the China Semiconductor (SW) Index advanced 15.7%.
Figure 6: Trend of SOX and SW Index in August
Source: Wind,Chip Insights
For more information, please refer to the attached report:
Electronic Components Sales Market Analysis and Forecast (August 2026)