Electronic Components Sales Market Analysis and Forecast (June 2026)
Table Of Contents
Prologue
1 Macroeconomic Situation in June
1.1 Global Manufacturing Stays Expansionary with Slowing Recovery Momentum
1.2 Electronic Information Manufacturing Posts Improved Profitability and Rapid Growth
1.3 Upward Semiconductor Sales Cycle Sustains Strong Growth
2 Chip Lead Time Trends in June
2.1 Overall Chip Lead Time Trends
2.2 Overview of Lead Times for Key Chip Suppliers
3 Order and Inventory Status in June
4 Semiconductor Supply Chain in June
4.1 Upstream Semiconductor Manufacturers
(1)Silicon Wafer/Equipment
(2)Fabless/IDM
(3)Foundry
(4)OSAT
4.2 Distributor
4.3 System Integration
4.4 Terminal Application
(1)Consumer Electronics
(2)New Energy Vehicles
(3)Industrial Control
(4)Photovoltaic
(5)Energy Storage
(6)Data Center
(7)Communication
(8)Medical Equipment
5 Distribution and Sourcing Opportunities and Risks
5.1 Opportunities
5.2 Risk
6 Summarize
Disclaimer
Prologue
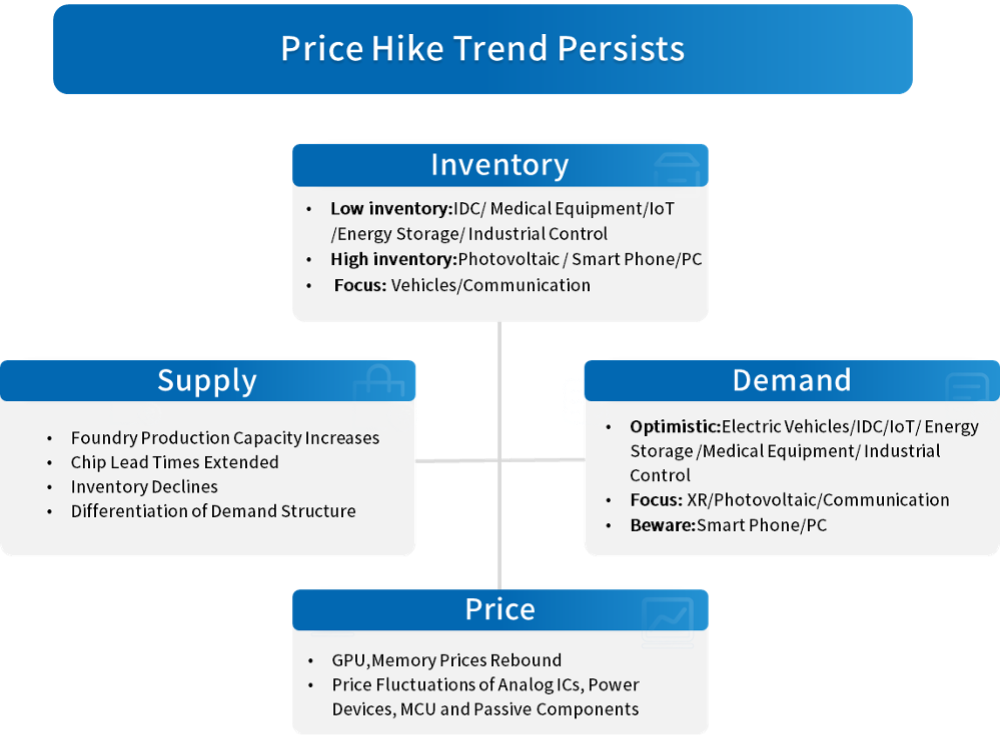
1 Macroeconomic Situation in June
1.1 Global Manufacturing Stays Expansionary with Slowing Recovery Momentum
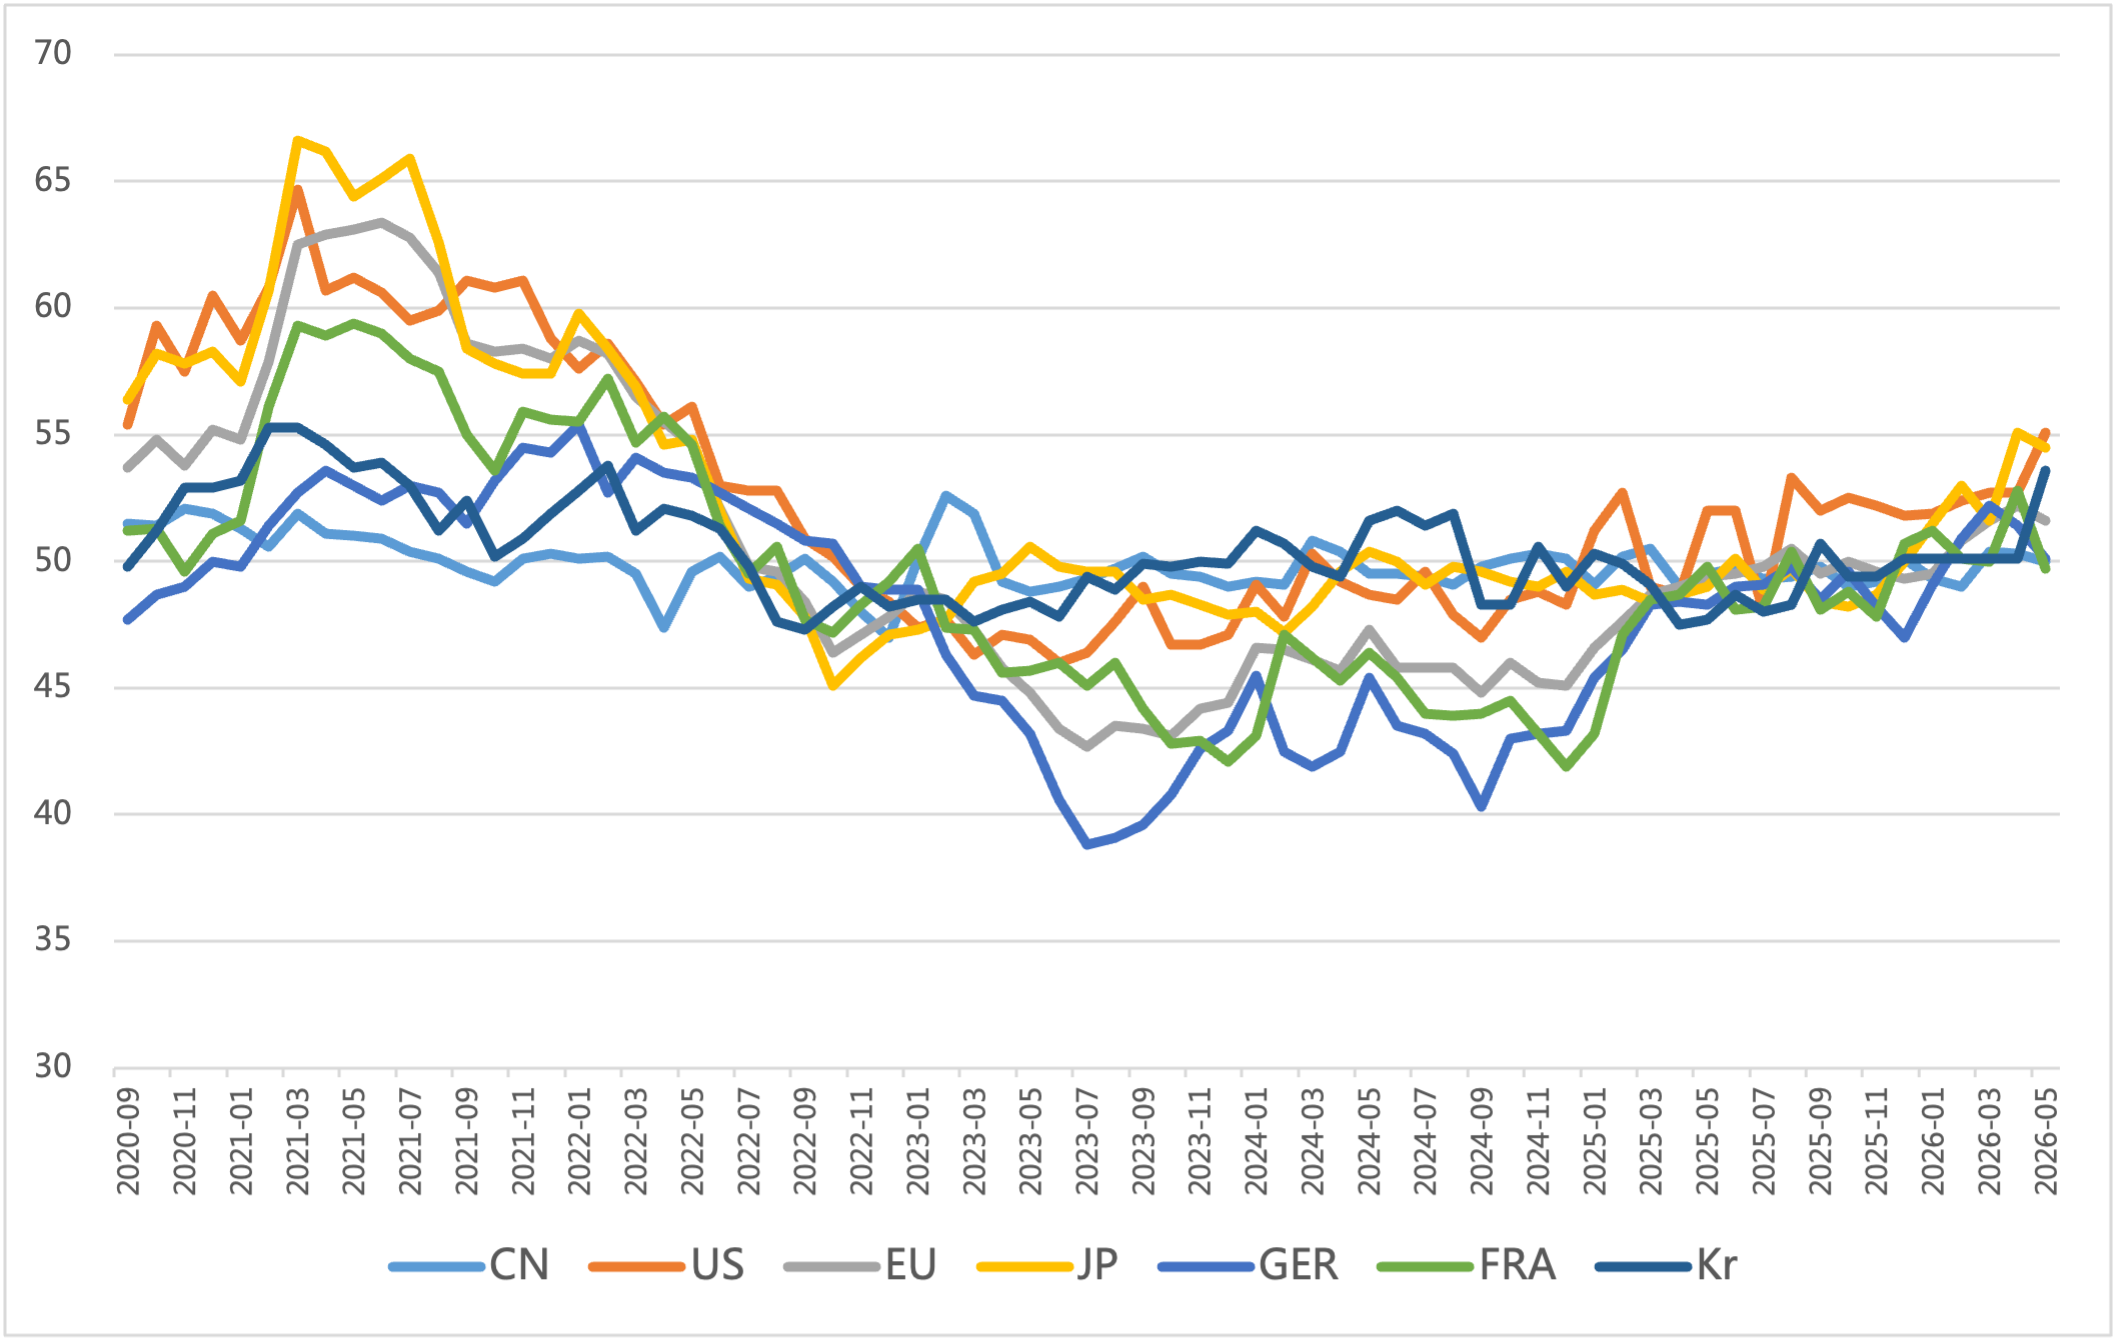
In June, the global manufacturing PMI remained within expansion territory, yet recovery momentum weakened. All major economies stayed expansionary, while total industrial goods trade continued to contract. the market shifted from incremental expansion to stock competition. Notably, the cycle of passive inventory restocking among global enterprises reversed, and a proactive destocking cycle officially began. In addition, tensions in the Middle East remained volatile, and risks of supply chain disruptions have not been fully eliminated.
Chart 1: Manufacturing PMI of the world's major economies in June
Source: NBSPRC
1.2 Electronic Information Manufacturing Posts Improved Profitability and Rapid Growth
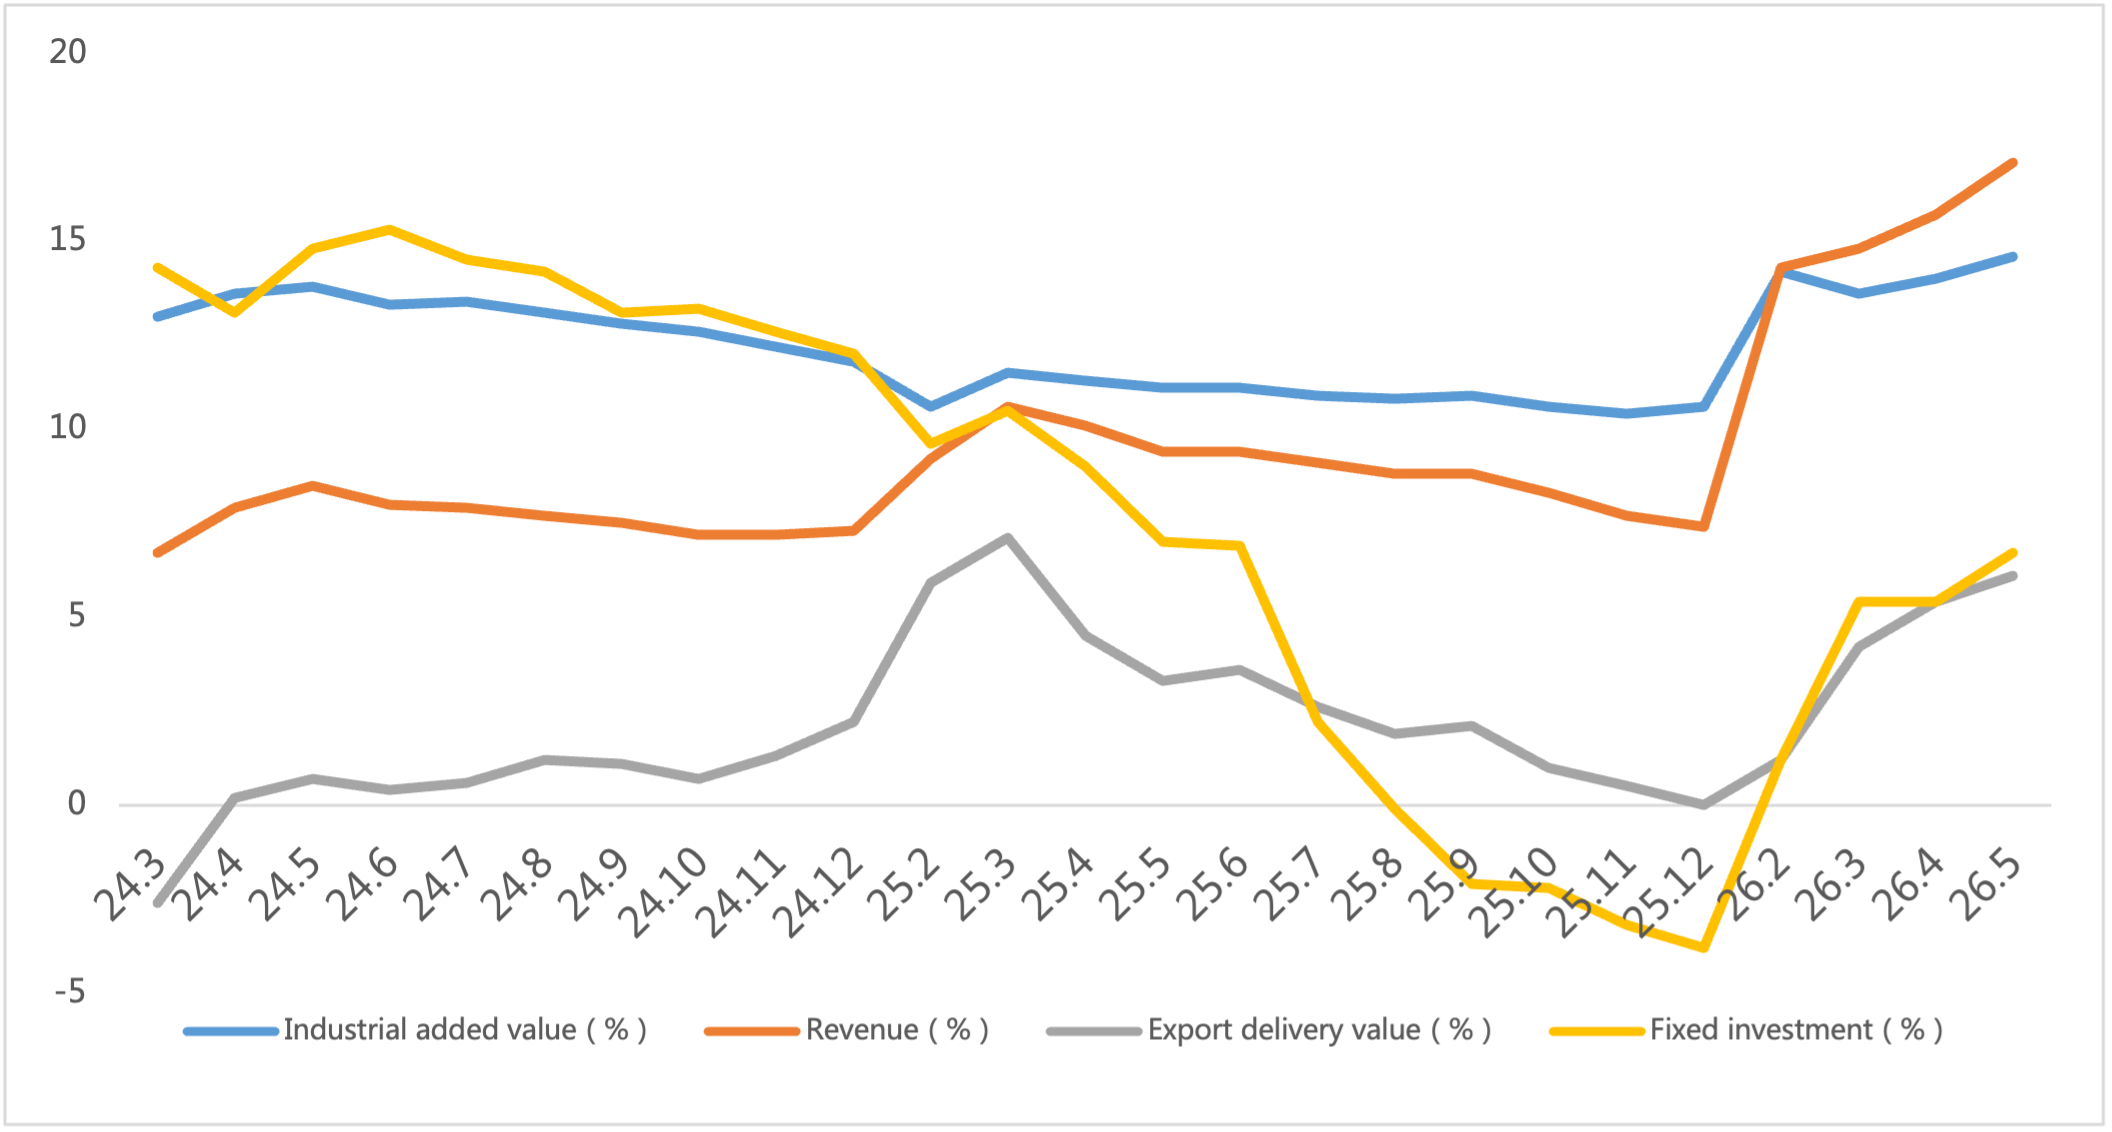
From January to May 2026, China’s electronic information manufacturing sector recorded robust production growth, steady export performance, markedly improved profitability and accelerated investment growth, showing a generally sound development trend.
Chart 2: Latest Operation of Electronic Information Manufacturing Industry
Source: MIIT
1.3 Upward Semiconductor Sales Cycle Sustains Strong Growth
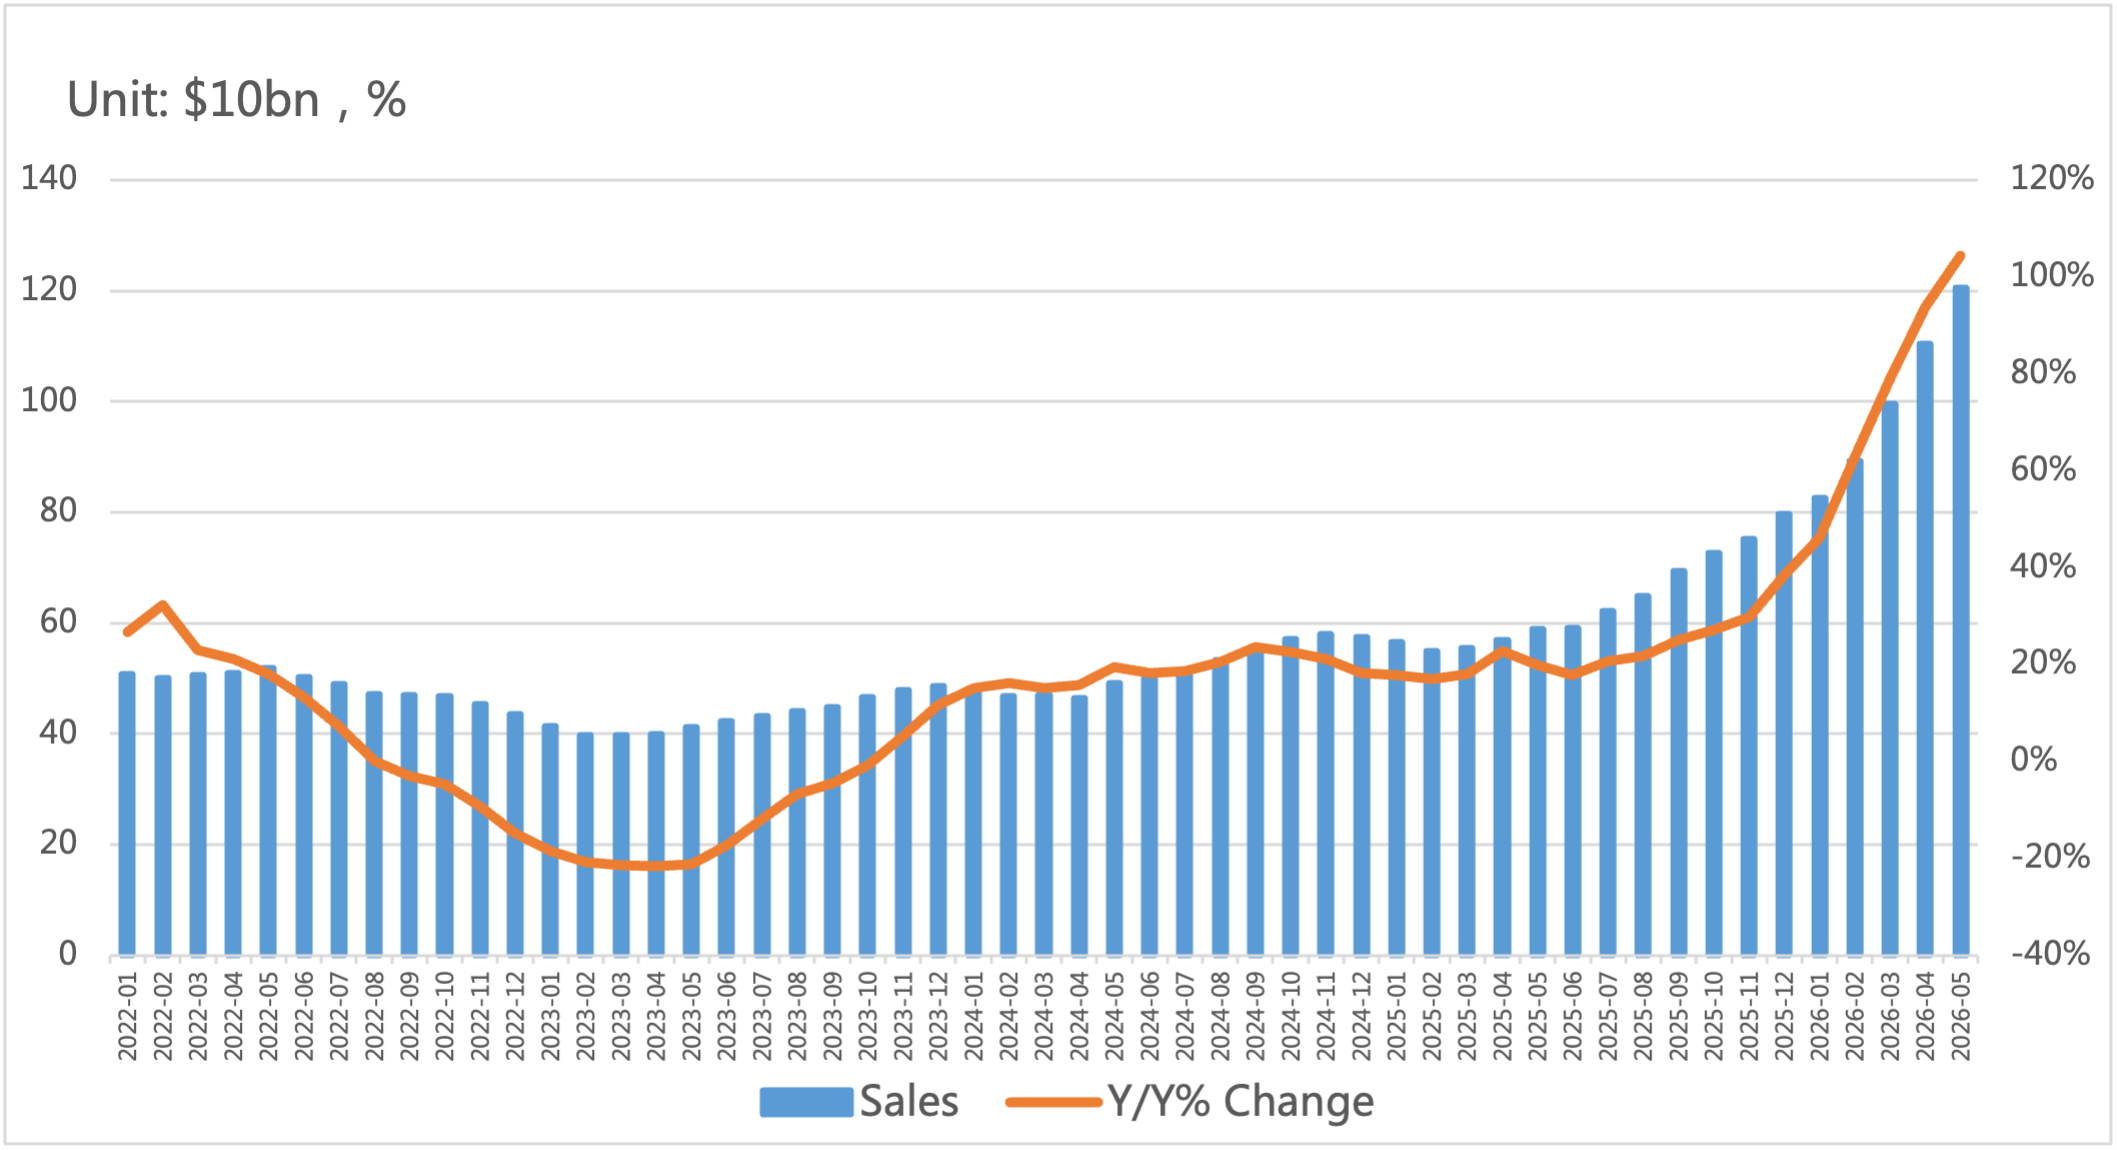
Per the latest SIA data, global semiconductor market sales reached USD 120.61 billion in May, up 104.1% year-on-year and marking the 15th consecutive month of month-on-month growth.
By regional market, sales in the Americas rose 132.2% YoY, China’s market increased 88.8% YoY, and the Asia-Pacific, Japan and Europe posted YoY growth of 118.9%, 23.8% and 60.7% respectively. The Americas, Asia-Pacific and China continued to lead the upward global semiconductor cycle.
Chart 3: Latest global semiconductor industry sales and growth rate
Source: SIA,Chip Insights
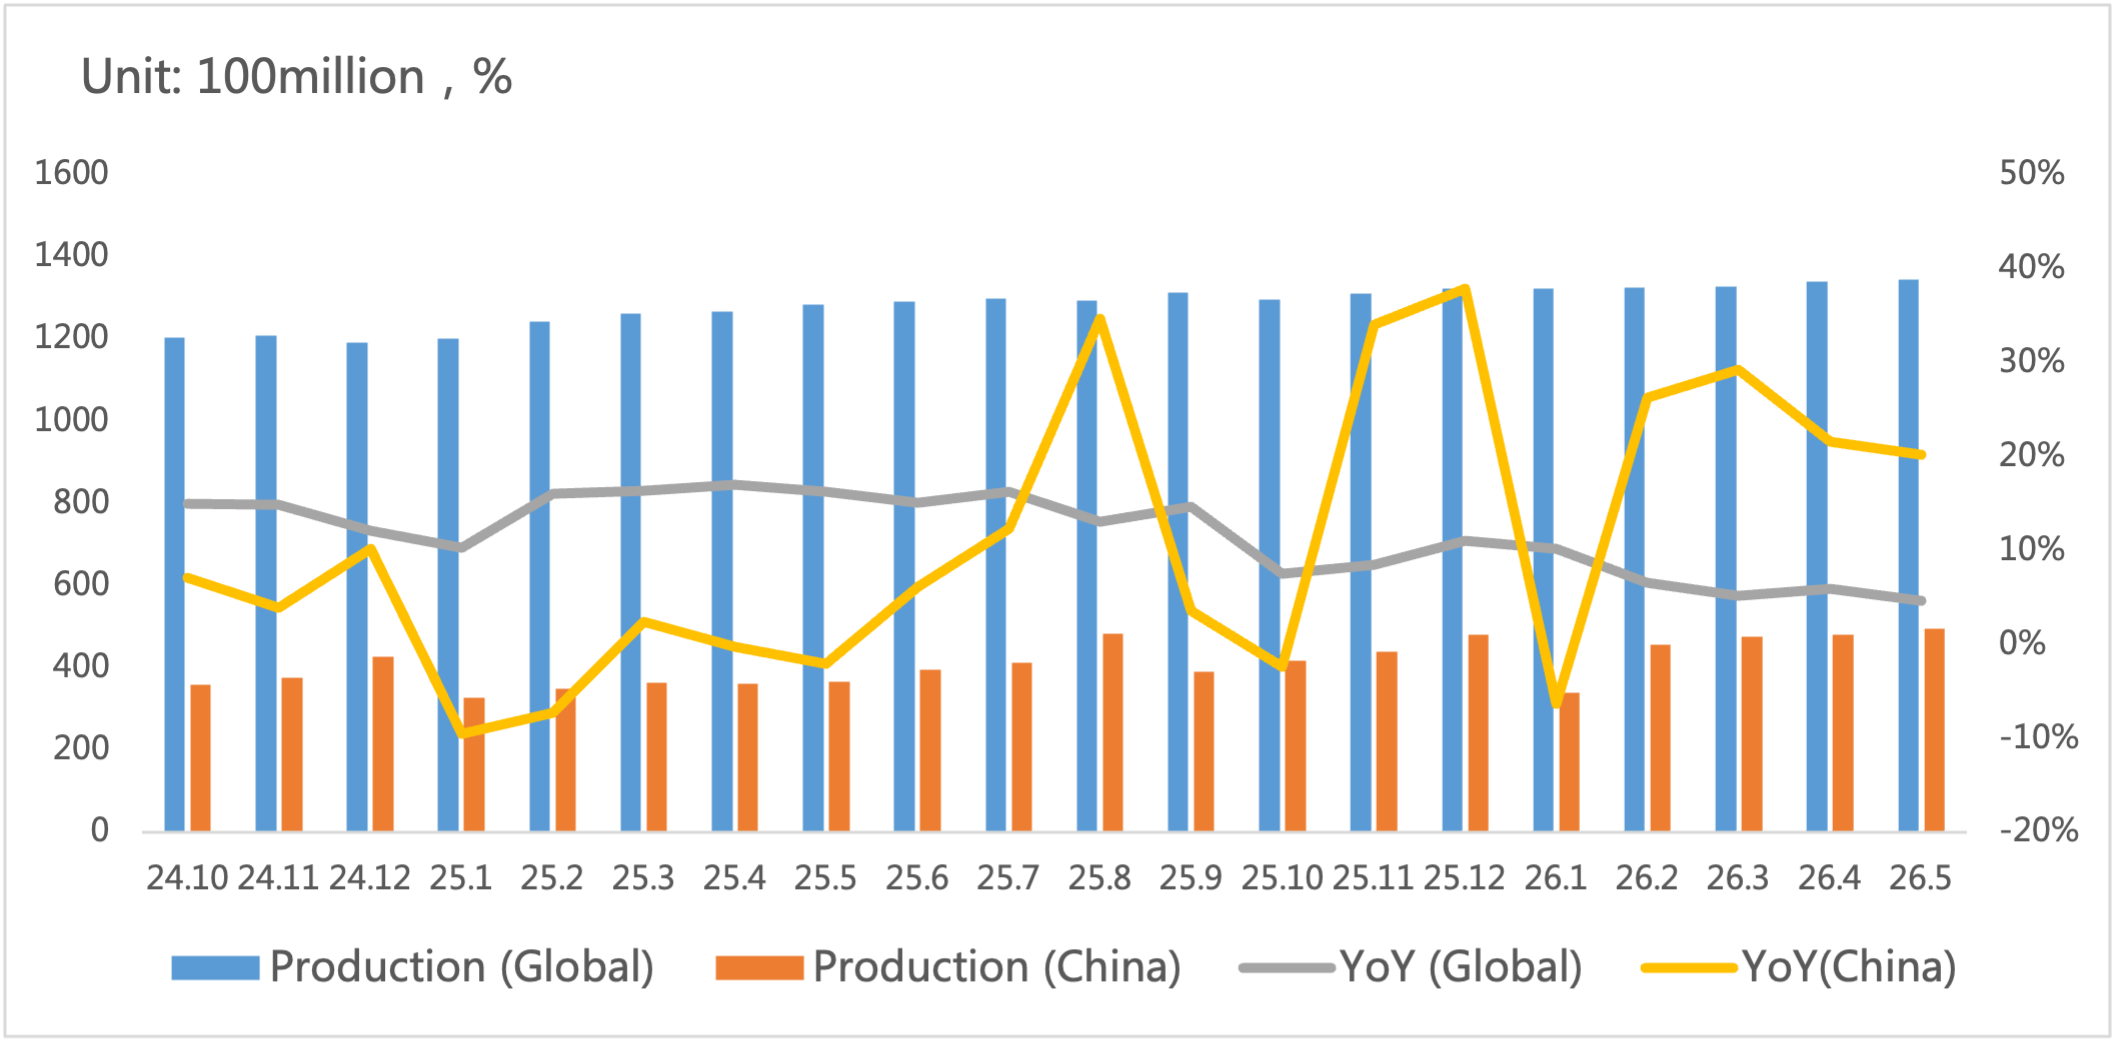
In terms of integrated circuit output, global and Chinese IC production exceeded 134.4 billion units and 49.5 billion units respectively in May, maintaining growth.
Chart 4: Latest global and Chinese integrated circuit production and growth rate
Source: WSTS,SIA,Chip Insights
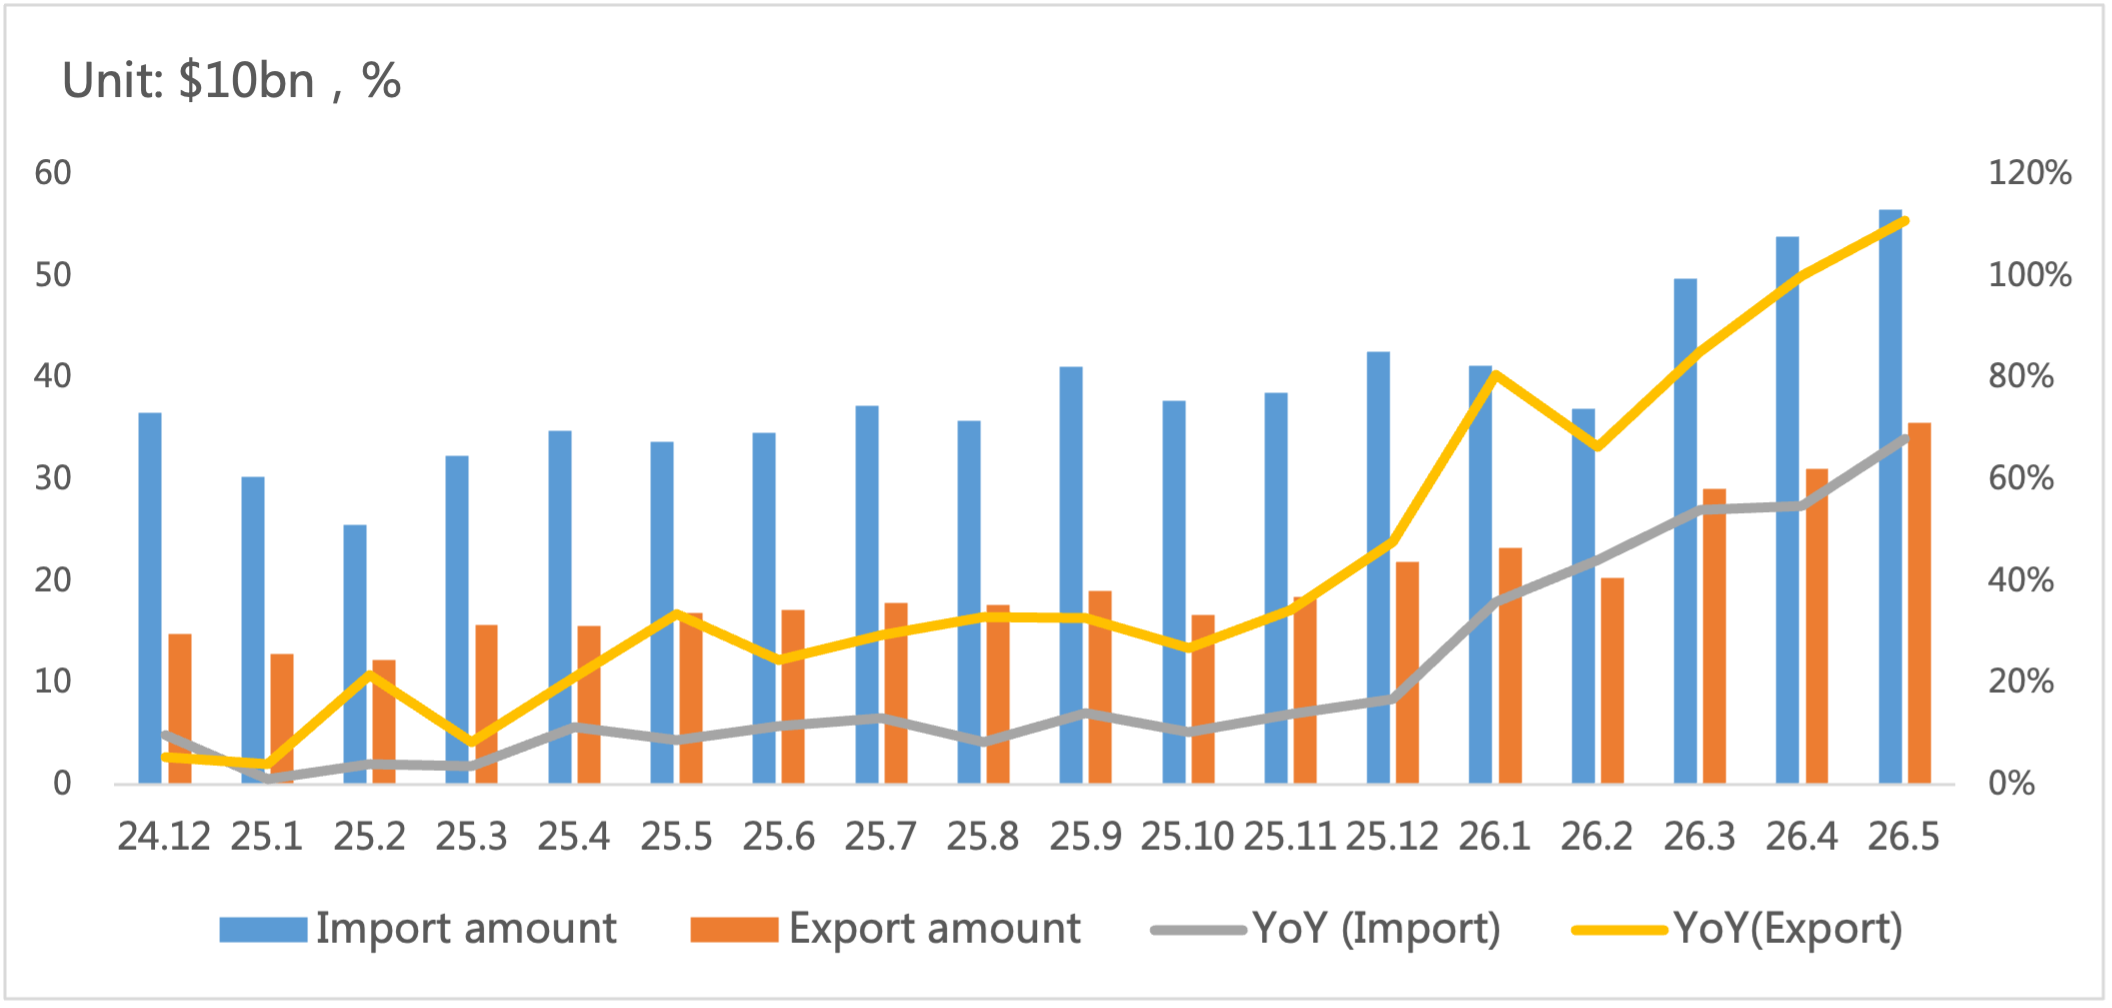
On import and export, China’s IC trade maintained high growth in May, with export growth exceeding 100% for two consecutive months.
Chart 5: Latest import and export amount and growth rate of integrated circuits in China
Source: MIIT,SIA,Chip Insights
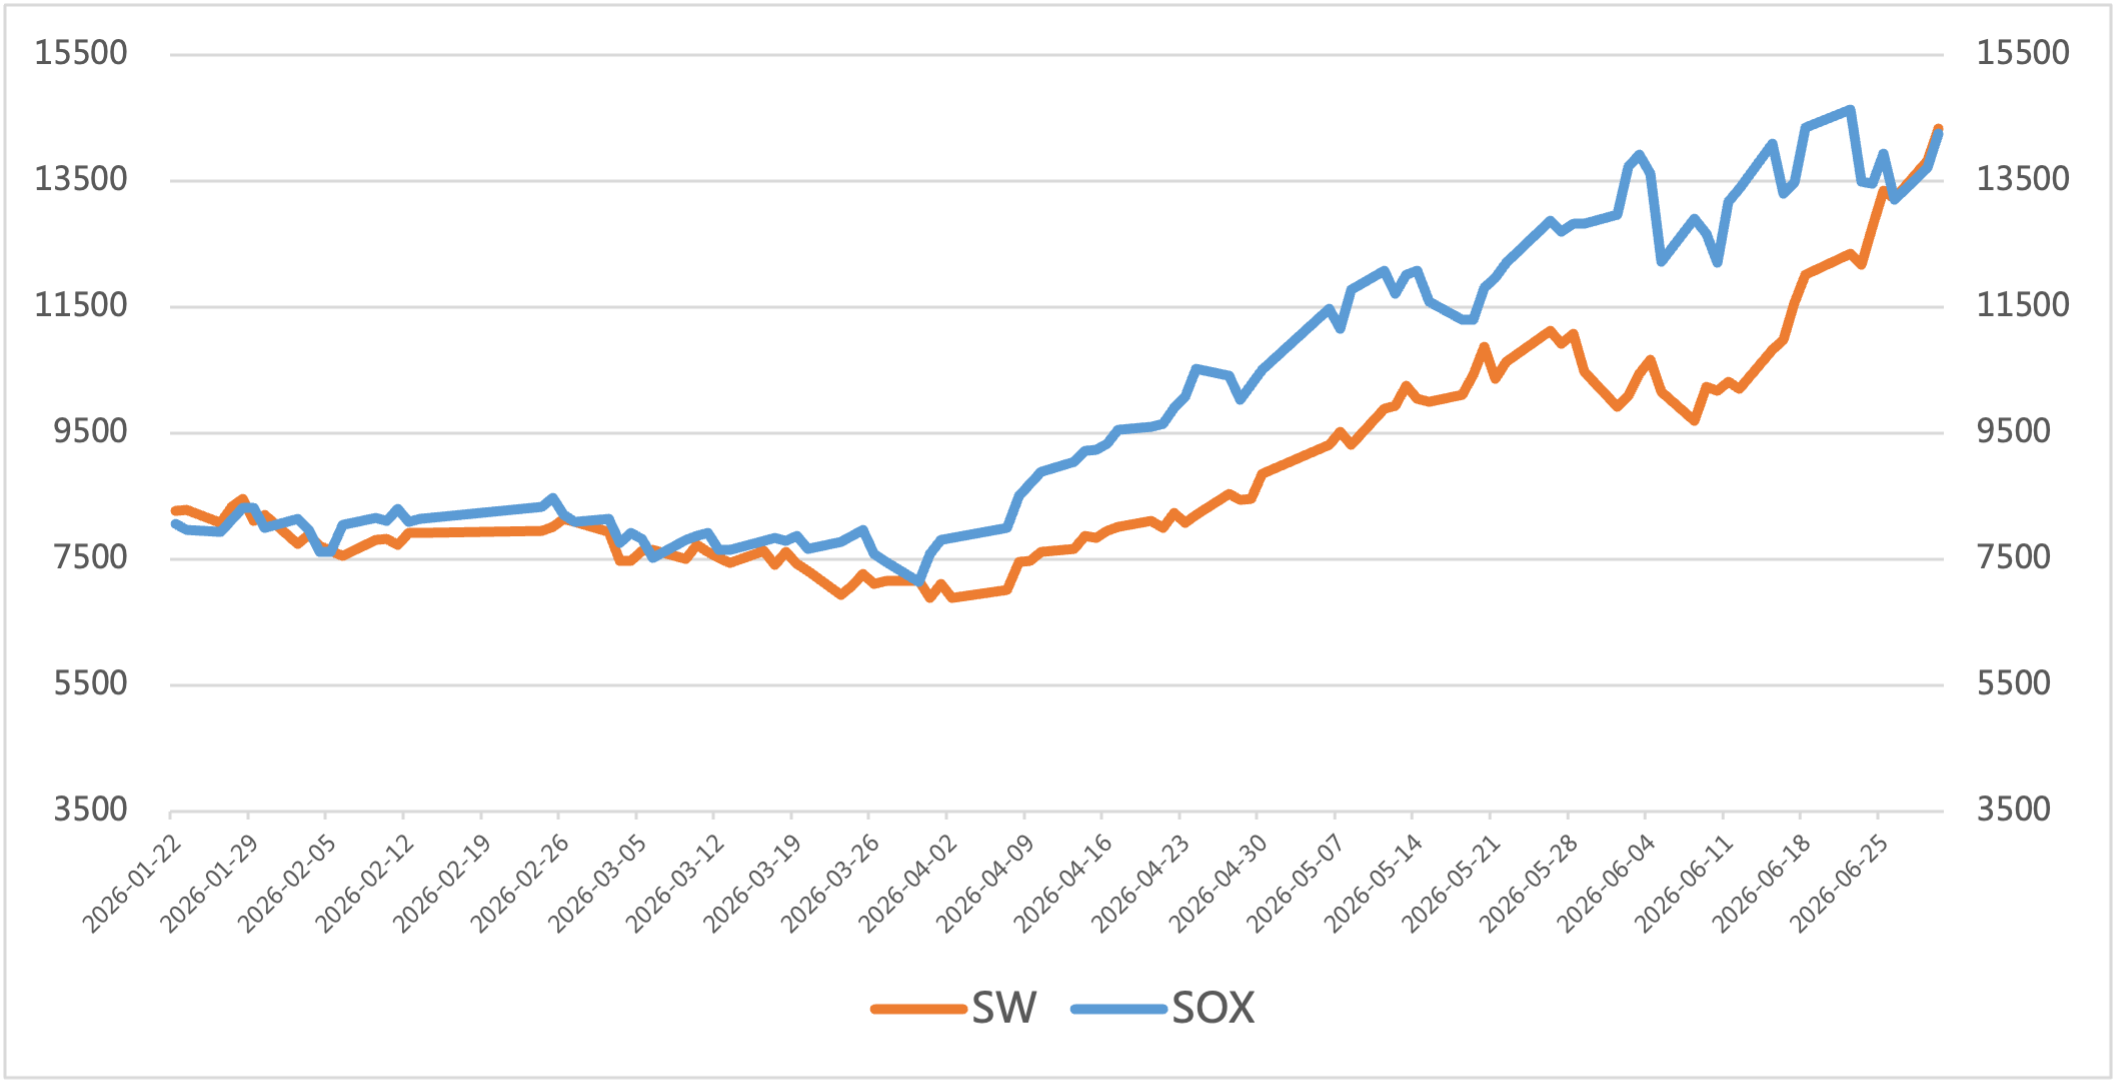
As for capital market indices, the Philadelphia Semiconductor Index (SOX) rose 9.9% in June, with a cumulative gain of over 81% in Q2 2026 — its strongest quarterly performance since the index’s launch in 1994, backed by continuous heavy investment in AI infrastructure. The SW Semiconductor Index climbed 44.6% in June, with a half-year cumulative gain exceeding 105%, fueled by robust booming demand across the semiconductor industry.
Chart 6: Trend of SOX and SW Index in June
Source: Wind,Chip Insights
For more information, please refer to the attached report.