Electronic Components Sales Market Analysis and Forecast (January 2026)
Table Of Contents
Prologue
1 Macroeconomics in January
1.1 The Global Manufacturing Sector Posted a Modest Expansion
1.2 Investment in the Electronic Information Manufacturing Industry Declined
1.3 Strong Semiconductor Sales
2 Chip Delivery Trend in January
2.1 The Overall Chip Delivery Trend
2.2 List of Delivery Cycles of Key Chip Suppliers
3 Orders and Inventory in January
4 Semiconductor Supply Chain in January
4.1 Semiconductor Upstream Manufacturers
(1)Silicon Wafer/Equipment
(2)Fabless/IDM
(3)Foundry
(4)OSAT
4.2 Distributor
4.3 System Integration
4.4 Terminal Application
(1)Consumer Electronics
(2)New Energy Vehicles
(3)Industrial Control
(4)Photovoltaic
(5)Energy Storage
(6)Data Center
(7)Communication
(8)Medical Equipment
5 Distribution and Sourcing Opportunities and Risks
5.1 Opportunities
5.2 Risk
6 Summarize
Disclaimer
Prologue
1 Macroeconomics in January
1.1 The Global Manufacturing Sector Posted a Modest Expansion
In January, the global manufacturing PMI maintained a mild expansion trend, yet market demand operated under pressure. The US, Japan and South Korea sustained steady growth, while China, the EU and other economies remained below the boom-bust line, with demand registering a slight decline due to seasonal factors and external impacts.
Chart 1: Manufacturing PMI of the world's major economies in January
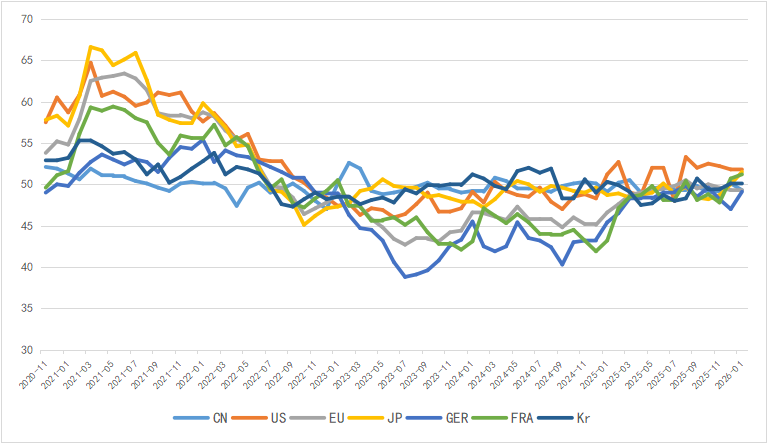
Source: NBSPRC
1.2 Investment in the Electronic Information Manufacturing Industry Declined
In 2025, China’s electronic information manufacturing industry saw rapid production growth, flat exports on a year-on-year basis, steady improvement in economic returns and a continuous decline in investment, with the industry maintaining a sound overall development momentum.
Chart 2: Latest Operation of Electronic Information Manufacturing Industry
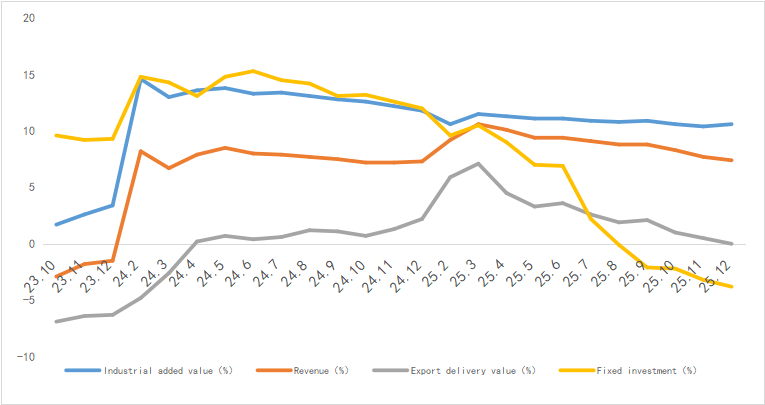
Source: MIIT
1.3 Strong Semiconductor Sales
market achieved sales revenue of 772.24 billion US dollars in 2025, representing a year-on-year (YoY) growth of 22.5%.
In terms of regional markets, the Asia-Pacific and the Americas led the market growth. The American market posted a YoY increase of 29.1%, while the Asia-Pacific region represented by China saw a YoY growth of 24.9%. By contrast, Japan and Europe recorded a YoY decline of 4.1% and a YoY growth of 9.6% in semiconductor sales respectively.
Chart 3: Latest global semiconductor industry sales and growth rate
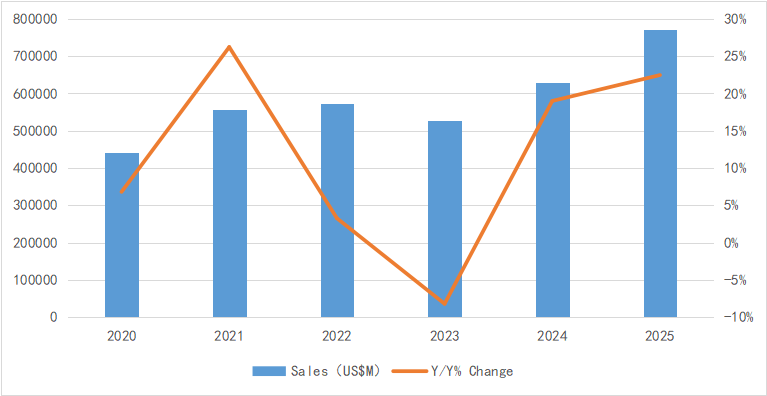
Source: SIA,Chip Insights
In terms of integrated circuit (IC) output, the global and Chinese IC output reached 132.2 billion units and 48.1 billion units in December respectively, maintaining a steady uptrend.
Chart 4: Latest global and Chinese integrated circuit production and growth rate
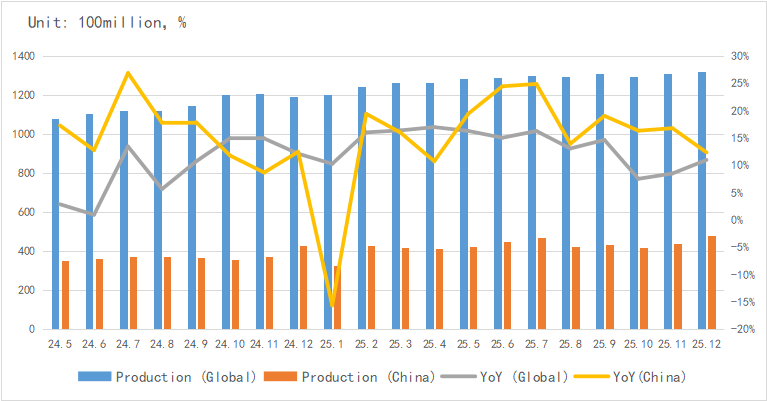
Source: WSTS,SIA,Chip Insights
Regarding imports and exports, China's IC exports continued their robust growth in December, with an average growth rate of approximately 27% over the past year.
Chart 5: Latest import and export amount and growth rate of integrated circuits in China
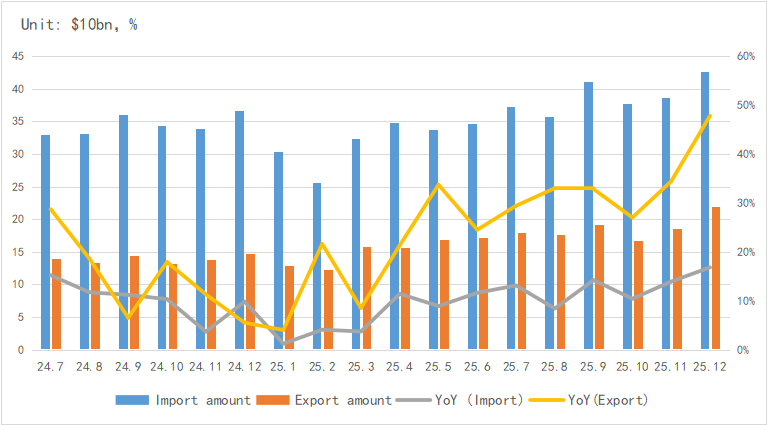
Source: MIIT,SIA,Chip Insights
From the perspective of capital market indices, the Philadelphia Semiconductor Index (SOX) dropped by 3.9% in January, while the China Semiconductor (SW) Industry Index edged up by 1.1%. The capital market remained relatively stable with a high level of industry prosperity.
Chart 6: Trend of SOX and SW Index in January
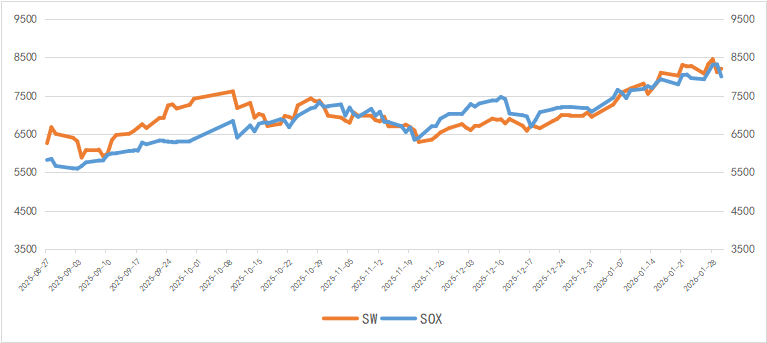
Source: Wind,Chip Insights
For more information, please refer to the attached report.