Electronic Components Sales Market Analysis and Forecast (Q1 2023)
Table Of Contents
Prologue
1 Macroeconomics and Semiconductor Trade
1.1 Macroeconomic Analysis
(1)Global Manufacturing Index Continues to Decline
(2)The Electronic Information Manufacturing Industry Continues to Be Sluggish
1.2 Semiconductor Market Analysis
(1)Semiconductor Sales Trend Rebounds
(2)The Semiconductor Index Trend Differentiation
1.3 Chip Delivery Trend
(1)Chip Delivery Trend
(2)Supplier Delivery Cycle Summary
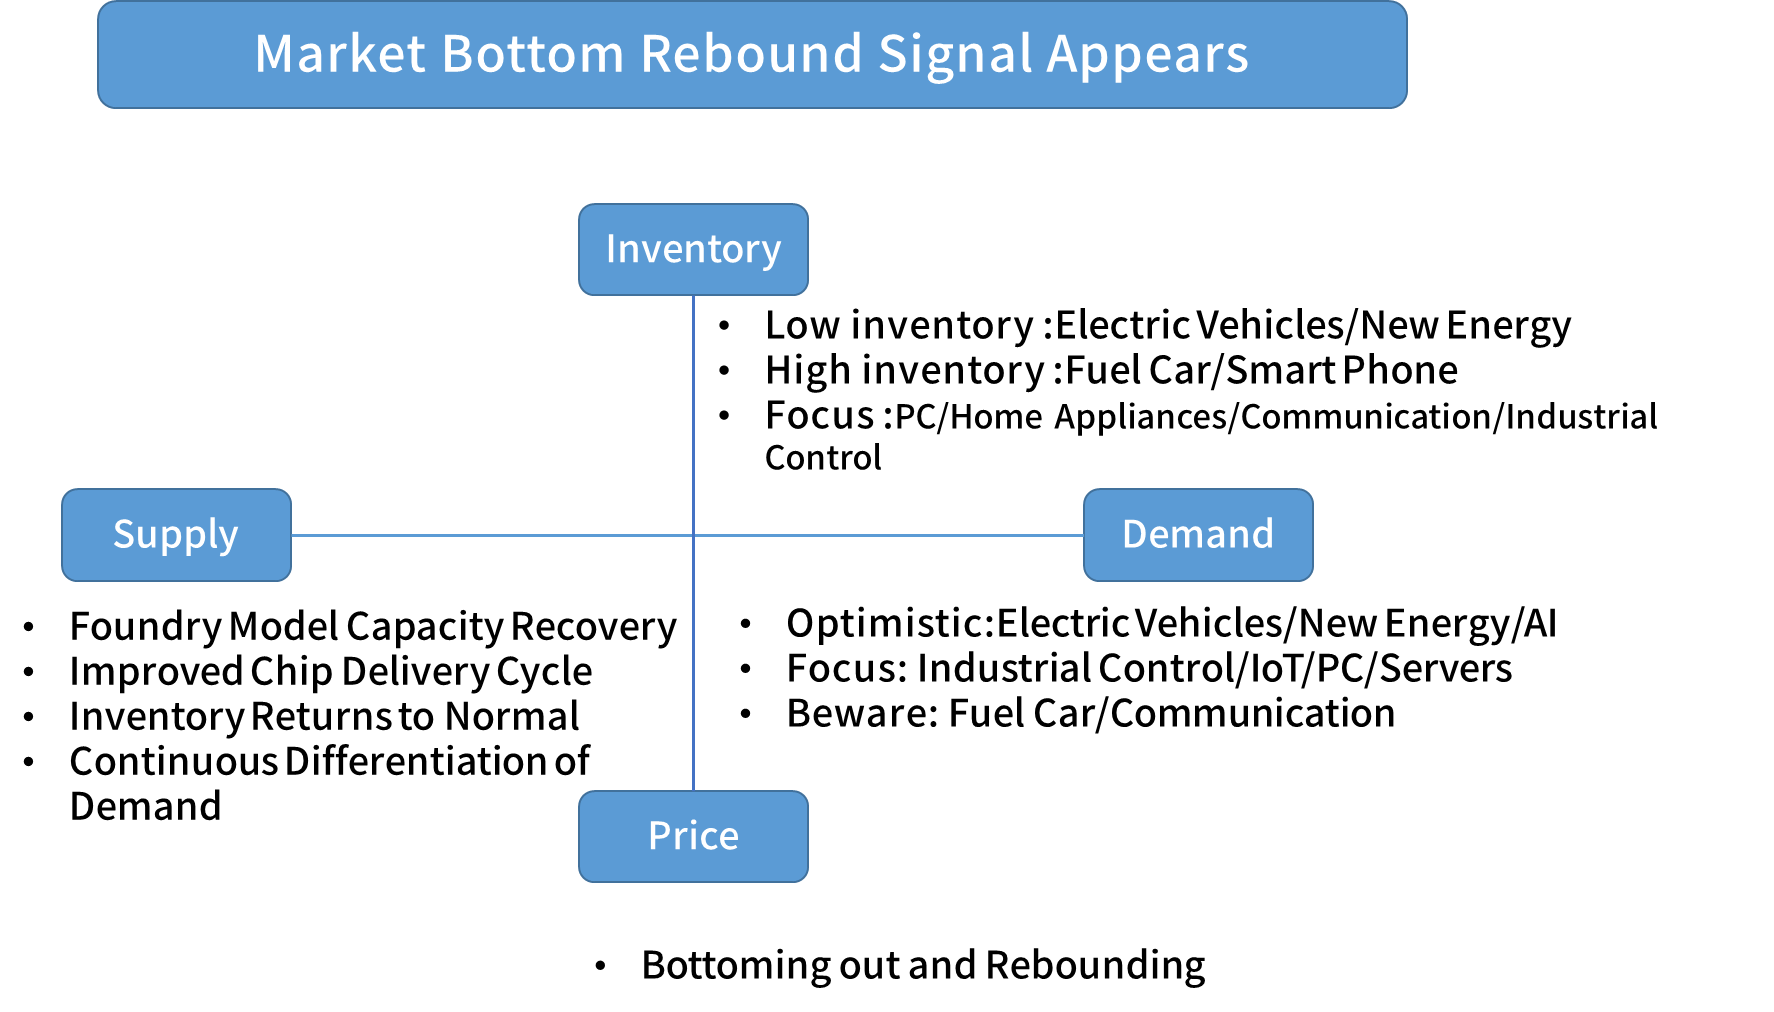
1.4 Orders and Inventory Situation
2 Semiconductor Supply Chain
2.1 Semiconductor Upstream Manufacturers
(1)Silicon Wafer/Equipment
(2)Fabless/IDM
(3)Foundry
(4)OSAT
2.2 Distributor
2.3 System Integration
2.4 Terminal Application
(1)Consumer Electronics
(2)Automobile
(3)Industrial Control
(4)Photovoltaic
(5)Energy Storage
(6)Service Machine
(7)Communications
3 Distribution and procurement opportunities and risks
3.1 Opportunities
3.2 Risk
4 Summarize
Disclaimer
Prologue
1 Macroeconomics and Semiconductor Trade
1.1 Macroeconomic Analysis
(1)Global Manufacturing Index Continues to Decline
In Q2 2023, The global economy continues to fluctuate and decline, with major economies such as China, the United States, the European Union, and Japan all below the critical point, and the global economic outlook remains unstable.
Chart 1: Manufacturing PMIs of Major Global Economies in Q2
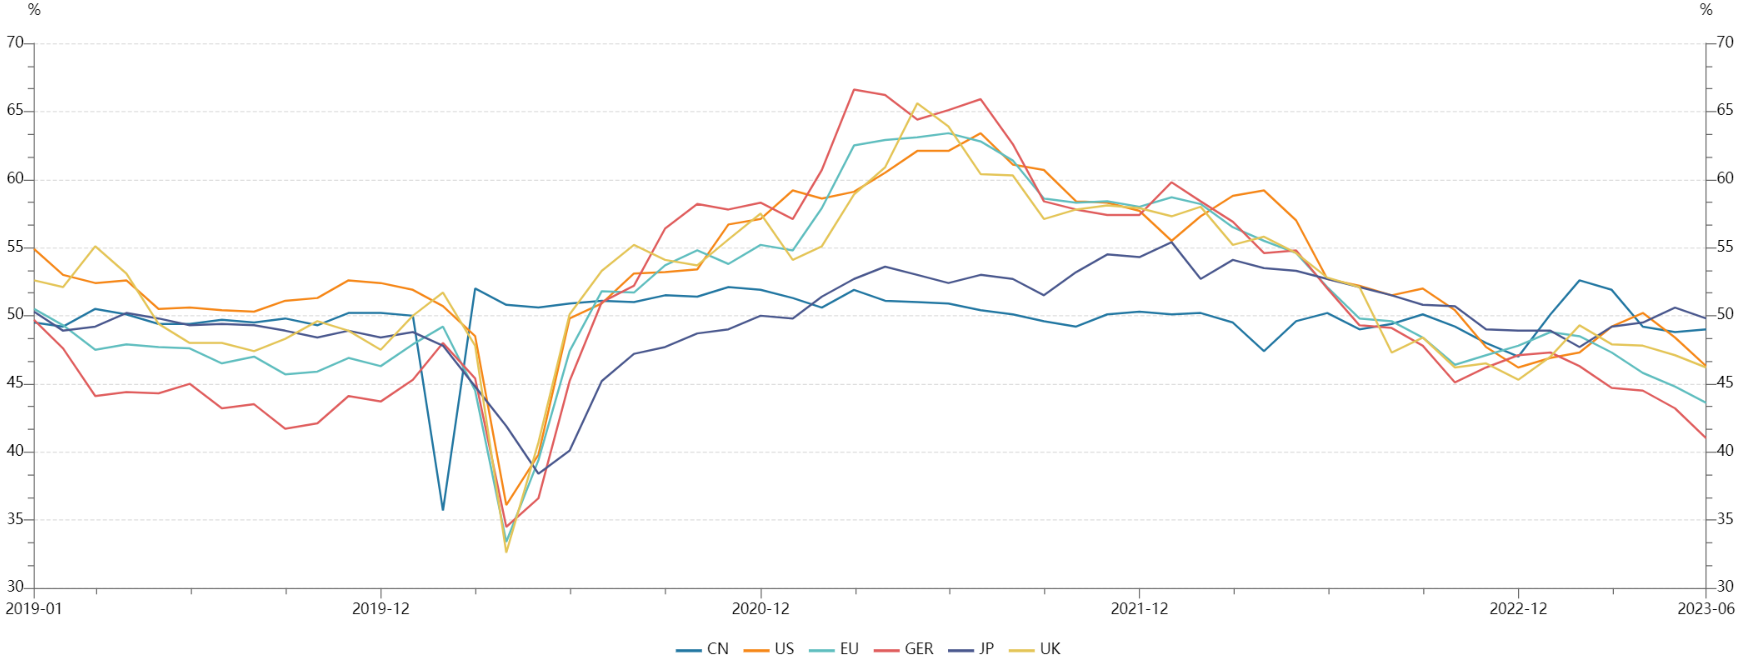
Source: NBSPRC
(2)The Electronic Information Manufacturing Industry Continues to Be Sluggish
From January to May, the production of China's electronic information manufacturing industry continued to contract, but the investment scale remained on the rise.
Chart 2: Operation of Electronic Information Manufacturing Industry in May 2023
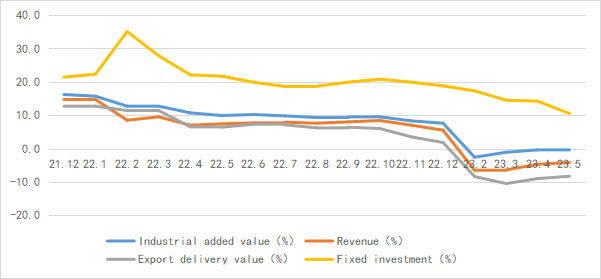
Source: MIIT、Chip Insights
1.2 Semiconductor Market Analysis
(1)Semiconductor Sales Trend Rebounds
In May, global semiconductor industry sales reached $40.74 billion, a year-on-year decrease of 21.1% and a month on month increase of 1.7%.
Chart 3: Global Semiconductor Industry Sales and Growth Rate in May 2023
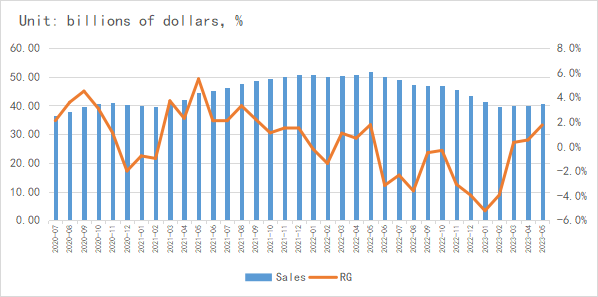
Source: SIA、Chip Insights
From a regional perspective, Europe is still the only region achieving growth, while Chinese Mainland is the worst performing region with a year-on-year decline of 29.5%.
(2)The Semiconductor Index Trend Differentiation
From the perspective of the capital market index, the SOX rose by 14.8% in Q2, and the SW Industry Index fell 12.5%. Affected by supply chain fluctuations, the domestic and foreign markets have shown opposite trends.
For more information, please refer to the attached report.